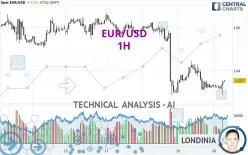
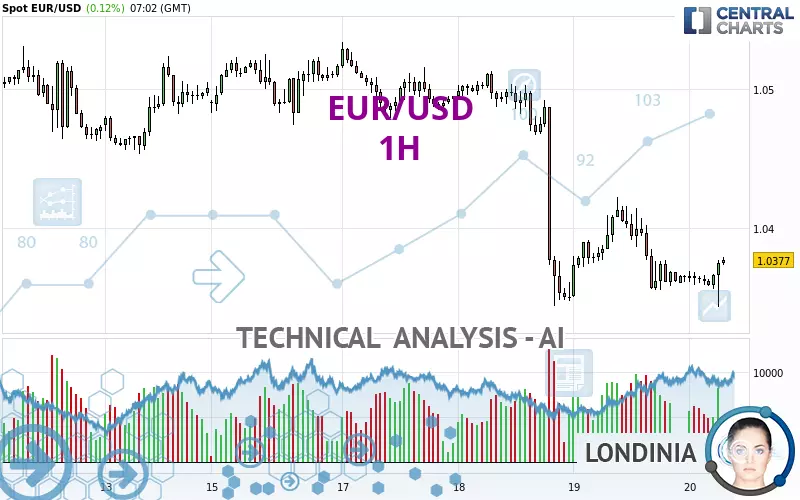
EUR/USD - 1H - Technical analysis published on 12/20/2024 (GMT)
- 231
- 0
Click here for a new analysis!
- Timeframe : 1H
- - Analysis generated on
- Status : INVALID
Summary of the analysis

Additional analysis
Quotes
The EUR/USD rating is 1.0377 USD. The price registered an increase of +0.12% on the session and was traded between 1.0343 USD and 1.0379 USD over the period. The price is currently at +0.33% from its lowest and -0.02% from its highest.The Central Gaps scanner detects a bearish opening. A small advantage for sellers in the very short term.
Bearish opening
Type : Bearish
Timeframe : Openning
Here is a more detailed summary of the historical variations registered by EUR/USD:
Near a new LOW record (1 year)
Type : Bearish
Timeframe : Weekly
Near a new LOW record (1st january)
Type : Bearish
Timeframe : Weekly
Near a new HIGH record (1 month)
Type : Bullish
Timeframe : Weekly
Technical
Technical analysis of EUR/USD in 1H shows an overall bearish trend. 78.57% of the signals given by moving averages are bearish. Caution: the neutral signals currently given by short-term moving averages show us that the global trend is losing momentum. The Central Indicators market scanner currently does not detect any result that concerns moving averages.
The technical indicators are generally neutral. They do not provide relevant information on the direction of future price movements.
Caution: the Central Indicators scanner currently detects an excess:
Williams %R indicator is overbought : over -20
Type : Neutral
Timeframe : 1 hour
Pivot points : price is under support 3
Type : Neutral
Timeframe : Weekly
Momentum indicator is back under 0
Type : Bearish
Timeframe : 1 hour
The analysis of the price chart with Central Patterns scanners does not return any result.
The Central Candlesticks scanner which studies Japanese candlesticks did not detect anything.
| S3 | S2 | S1 | Price | R1 | R2 | R3 | |
|---|---|---|---|---|---|---|---|
| ProTrendLines | 0.9596 | 1.0129 | 1.0344 | 1.0377 | 1.0430 | 1.0480 | 1.0533 |
| Change (%) | -7.53% | -2.39% | -0.32% | - | +0.51% | +0.99% | +1.50% |
| Change | -0.0781 | -0.0248 | -0.0033 | - | +0.0053 | +0.0103 | +0.0156 |
| Level | Intermediate | Minor | Intermediate | - | Major | Intermediate | Intermediate |
Pivot points can also be used to set your price objectives. Here is the price situation in relation to pivot points:
| Pivot points | S3 | S2 | S1 | PP | R1 | R2 | R3 |
|---|---|---|---|---|---|---|---|
| Standard | 1.0264 | 1.0307 | 1.0336 | 1.0379 | 1.0408 | 1.0451 | 1.0480 |
| Camarilla | 1.0345 | 1.0352 | 1.0358 | 1.0365 | 1.0372 | 1.0378 | 1.0385 |
| Woodie | 1.0257 | 1.0304 | 1.0329 | 1.0376 | 1.0401 | 1.0448 | 1.0473 |
| Fibonacci | 1.0307 | 1.0335 | 1.0352 | 1.0379 | 1.0407 | 1.0424 | 1.0451 |
| Pivot points | S3 | S2 | S1 | PP | R1 | R2 | R3 |
|---|---|---|---|---|---|---|---|
| Standard | 1.0297 | 1.0375 | 1.0438 | 1.0516 | 1.0579 | 1.0657 | 1.0720 |
| Camarilla | 1.0462 | 1.0475 | 1.0488 | 1.0501 | 1.0514 | 1.0527 | 1.0540 |
| Woodie | 1.0290 | 1.0371 | 1.0431 | 1.0512 | 1.0572 | 1.0653 | 1.0713 |
| Fibonacci | 1.0375 | 1.0429 | 1.0462 | 1.0516 | 1.0570 | 1.0603 | 1.0657 |
| Pivot points | S3 | S2 | S1 | PP | R1 | R2 | R3 |
|---|---|---|---|---|---|---|---|
| Standard | 0.9690 | 1.0012 | 1.0294 | 1.0616 | 1.0898 | 1.1220 | 1.1502 |
| Camarilla | 1.0411 | 1.0466 | 1.0522 | 1.0577 | 1.0632 | 1.0688 | 1.0743 |
| Woodie | 0.9671 | 1.0002 | 1.0275 | 1.0606 | 1.0879 | 1.1210 | 1.1483 |
| Fibonacci | 1.0012 | 1.0242 | 1.0385 | 1.0616 | 1.0846 | 1.0989 | 1.1220 |
Numerical data
The following is the status of the technical indicators and moving averages at the time of publication of this technical analysis:
| RSI (14): | 43.30 | |
| MACD (12,26,9): | -0.0012 | |
| Directional Movement: | -14.3143 | |
| AROON (14): | -100.0000 | |
| DEMA (21): | 1.0356 | |
| Parabolic SAR (0,02-0,02-0,2): | 1.0394 | |
| Elder Ray (13): | -0.0011 | |
| Super Trend (3,10): | 1.0396 | |
| Zig ZAG (10): | 1.0371 | |
| VORTEX (21): | 0.7848 | |
| Stochastique (14,3,5): | 41.53 | |
| TEMA (21): | 1.0361 | |
| Williams %R (14): | -20.59 | |
| Chande Momentum Oscillator (20): | -0.0003 | |
| Repulse (5,40,3): | 0.2418 | |
| ROCnROLL: | -1 | |
| TRIX (15,9): | -0.0194 | |
| Courbe Coppock: | 0.33 |
| MA7: | 1.0439 | |
| MA20: | 1.0499 | |
| MA50: | 1.0643 | |
| MA100: | 1.0851 | |
| MAexp7: | 1.0365 | |
| MAexp20: | 1.0373 | |
| MAexp50: | 1.0402 | |
| MAexp100: | 1.0436 | |
| Price / MA7: | -0.59% | |
| Price / MA20: | -1.16% | |
| Price / MA50: | -2.50% | |
| Price / MA100: | -4.37% | |
| Price / MAexp7: | +0.12% | |
| Price / MAexp20: | +0.04% | |
| Price / MAexp50: | -0.24% | |
| Price / MAexp100: | -0.57% |
News
The latest news and videos published on EUR/USD at the time of the analysis were as follows:
-
 EUR/USD Forecast - Euro Can't Find Any Help (December 20, 2024)
-
EUR/USD - Is the Euro Doomed? (December 19, 2024)
-
Yearly Technical Outlook 2025 : 13/12/2024 - USDJPY, EURUSD, GBPUSD
-
Technical Outlook on USDJPY, EURUSD, USDCAD
-
Technical Outlook on USDJPY, EURUSD, USDCAD
About author

Online


Add a comment
Comments
0 comments on the analysis EUR/USD - 1H