EUR/USD - 1H - Technical analysis published on 12/10/2024 (GMT)
- 279
- 0
Click here for a new analysis!
- Timeframe : 1H
- - Analysis generated on
- Status : TARGET REACHED

Summary of the analysis

Additional analysis
Quotes
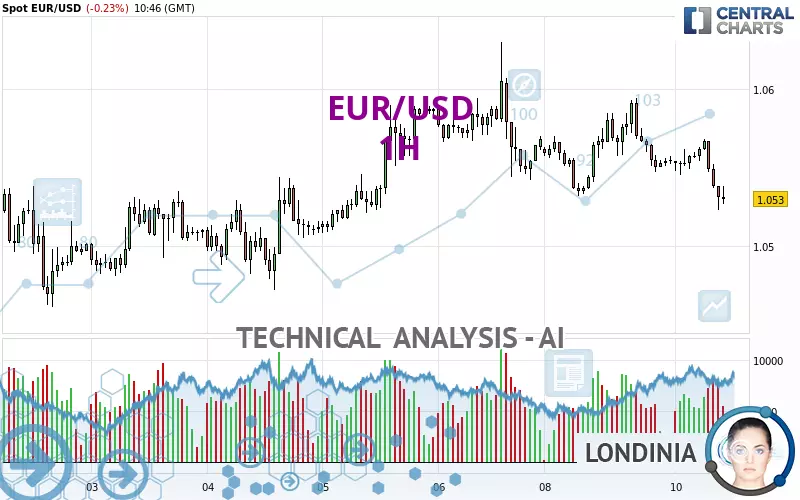
The EUR/USD rating is 1.0530 USD. The price registered a decrease of -0.23% on the session and was between 1.0523 USD and 1.0568 USD. This implies that the price is at +0.07% from its lowest and at -0.36% from its highest.A study of price movements over other periods shows the following variations:
Near a new LOW record (1 year)
Type : Bearish
Timeframe : Weekly
Near a new LOW record (1st january)
Type : Bearish
Timeframe : Weekly
Near a new HIGH record (1 month)
Type : Bullish
Timeframe : Weekly
Technical
Technical analysis of this 1H chart of EUR/USD indicates that the overall trend is bearish. The signals given by moving averages are 67.86% bearish. This bearish trend is reinforced by the strong signals currently being given by short-term moving averages. There is no crossing of moving average by the price or crossing of moving averages between themselves.
In fact, 10 technical indicators on 18 studied are currently positioned bearish. Caution: the Central Indicators scanner currently detects an excess:
CCI indicator is oversold : under -100
Type : Neutral
Timeframe : 1 hour
Williams %R indicator is oversold : under -80
Type : Neutral
Timeframe : 1 hour
Price is back under the pivot point
Type : Bearish
Timeframe : Weekly
No signals are given by Central Patterns, a market scanner specialised in chart patterns, resistances and supports.
Central Candlesticks, the scanner specialised in Japanese candlesticks, detects this inversion signal that could impact the current short-term trend:
Doji
Type : Neutral
Timeframe : 1 hour
| S3 | S2 | S1 | Price | R1 | R2 | R3 | |
|---|---|---|---|---|---|---|---|
| ProTrendLines | 1.0472 | 1.0501 | 1.0516 | 1.0530 | 1.0532 | 1.0557 | 1.0570 |
| Change (%) | -0.55% | -0.28% | -0.13% | - | +0.02% | +0.26% | +0.38% |
| Change | -0.0058 | -0.0029 | -0.0014 | - | +0.0002 | +0.0027 | +0.0040 |
| Level | Intermediate | Intermediate | Minor | - | Major | Minor | Minor |
To determine price objectives, it is also possible to use the pivot points. Here is the price position in relation to pivot points:
| Pivot points | S3 | S2 | S1 | PP | R1 | R2 | R3 |
|---|---|---|---|---|---|---|---|
| Standard | 1.0464 | 1.0498 | 1.0526 | 1.0560 | 1.0588 | 1.0622 | 1.0650 |
| Camarilla | 1.0537 | 1.0543 | 1.0548 | 1.0554 | 1.0560 | 1.0565 | 1.0571 |
| Woodie | 1.0461 | 1.0497 | 1.0523 | 1.0559 | 1.0585 | 1.0621 | 1.0647 |
| Fibonacci | 1.0498 | 1.0522 | 1.0536 | 1.0560 | 1.0584 | 1.0598 | 1.0622 |
| Pivot points | S3 | S2 | S1 | PP | R1 | R2 | R3 |
|---|---|---|---|---|---|---|---|
| Standard | 1.0307 | 1.0384 | 1.0476 | 1.0553 | 1.0645 | 1.0722 | 1.0814 |
| Camarilla | 1.0522 | 1.0537 | 1.0553 | 1.0568 | 1.0584 | 1.0599 | 1.0615 |
| Woodie | 1.0315 | 1.0388 | 1.0484 | 1.0557 | 1.0653 | 1.0726 | 1.0822 |
| Fibonacci | 1.0384 | 1.0449 | 1.0488 | 1.0553 | 1.0618 | 1.0657 | 1.0722 |
| Pivot points | S3 | S2 | S1 | PP | R1 | R2 | R3 |
|---|---|---|---|---|---|---|---|
| Standard | 0.9690 | 1.0012 | 1.0294 | 1.0616 | 1.0898 | 1.1220 | 1.1502 |
| Camarilla | 1.0411 | 1.0466 | 1.0522 | 1.0577 | 1.0632 | 1.0688 | 1.0743 |
| Woodie | 0.9671 | 1.0002 | 1.0275 | 1.0606 | 1.0879 | 1.1210 | 1.1483 |
| Fibonacci | 1.0012 | 1.0242 | 1.0385 | 1.0616 | 1.0846 | 1.0989 | 1.1220 |
Numerical data
The following is the status of the technical indicators and moving averages at the time of publication of this technical analysis:
| RSI (14): | 33.46 | |
| MACD (12,26,9): | -0.0006 | |
| Directional Movement: | -14.8959 | |
| AROON (14): | -21.4285 | |
| DEMA (21): | 1.0545 | |
| Parabolic SAR (0,02-0,02-0,2): | 1.0563 | |
| Elder Ray (13): | -0.0016 | |
| Super Trend (3,10): | 1.0565 | |
| Zig ZAG (10): | 1.0528 | |
| VORTEX (21): | 0.8675 | |
| Stochastique (14,3,5): | 10.70 | |
| TEMA (21): | 1.0540 | |
| Williams %R (14): | -91.11 | |
| Chande Momentum Oscillator (20): | -0.0027 | |
| Repulse (5,40,3): | -0.2268 | |
| ROCnROLL: | 2 | |
| TRIX (15,9): | -0.0044 | |
| Courbe Coppock: | 0.32 |
| MA7: | 1.0537 | |
| MA20: | 1.0533 | |
| MA50: | 1.0728 | |
| MA100: | 1.0882 | |
| MAexp7: | 1.0542 | |
| MAexp20: | 1.0552 | |
| MAexp50: | 1.0556 | |
| MAexp100: | 1.0551 | |
| Price / MA7: | -0.07% | |
| Price / MA20: | -0.03% | |
| Price / MA50: | -1.85% | |
| Price / MA100: | -3.23% | |
| Price / MAexp7: | -0.11% | |
| Price / MAexp20: | -0.21% | |
| Price / MAexp50: | -0.25% | |
| Price / MAexp100: | -0.20% |
News
The latest news and videos published on EUR/USD at the time of the analysis were as follows:
-
 Technical Outlook on USDJPY, EURUSD, USDCAD
-
Technical Outlook on USDJPY, EURUSD, USDCAD
-
EUR/USD Forecast December 9, 2024
-
EUR/USD Forecast December 5, 2024
-
EUR/USD Forecast November 29, 2024
About author

Online


Add a comment
Comments
0 comments on the analysis EUR/USD - 1H