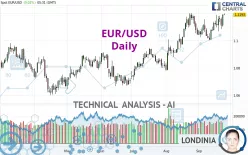
EUR/USD - Daily - Technical analysis published on 09/25/2024 (GMT)
- 163
- 0
Click here for a new analysis!
- Timeframe : Daily
- - Analysis generated on
- Status : INVALID

Summary of the analysis

Additional analysis
Quotes
The EUR/USD rating is 1.1193 USD. The price registered an increase of +0.02% on the session with the lowest point at 1.1185 USD and the highest point at 1.1199 USD. The deviation from the price is +0.07% for the low point and -0.05% for the high point.So that you have an overall view of the price change, here is a table showing the variations over several periods:
Near a new HIGH record (1 year)
Type : Bullish
Timeframe : Weekly
Near a new HIGH record (1st january)
Type : Bullish
Timeframe : Weekly
Near a new LOW record (1 month)
Type : Bearish
Timeframe : Weekly
Technical
A technical analysis in Daily of this EUR/USD chart shows a strongly bullish trend. The signals given by the moving averages are 92.86% bullish. This strong bullish trend is confirmed by the strong signals currently being given by short-term moving averages. An assessment of moving averages reveals a bullish signal that could impact this trend:
Bullish trend reversal : Moving Average 20
Type : Bullish
Timeframe : Daily
The probability of a further increase is high given the direction of the technical indicators.
Caution: the Central Indicators scanner currently detects an excess:
CCI indicator is overbought : over 100
Type : Neutral
Timeframe : Daily
Williams %R indicator is overbought : over -20
Type : Neutral
Timeframe : Daily
Ichimoku - Bullish crossover : Tenkan & Kijun
Type : Bullish
Timeframe : Daily
Central Patterns, the market scanner focusing on chart patterns, resistances and supports found these results:
Near resistance of channel
Type : Bearish
Timeframe : Daily
Horizontal resistance is broken
Type : Bullish
Timeframe : Daily
No result was found by the Central Candlesticks scanner on Japanese candlesticks.
| S3 | S2 | S1 | Price | R1 | R2 | R3 | |
|---|---|---|---|---|---|---|---|
| ProTrendLines | 1.0953 | 1.1109 | 1.1191 | 1.1193 | 1.1235 | 1.1456 | 1.1723 |
| Change (%) | -2.14% | -0.75% | -0.02% | - | +0.38% | +2.35% | +4.74% |
| Change | -0.0240 | -0.0084 | -0.0002 | - | +0.0042 | +0.0263 | +0.0530 |
| Level | Intermediate | Intermediate | Major | - | Intermediate | Minor | Minor |
To determine price objectives, it is also possible to use the pivot points. Here is the price position in relation to pivot points:
| Pivot points | S3 | S2 | S1 | PP | R1 | R2 | R3 |
|---|---|---|---|---|---|---|---|
| Standard | 1.1044 | 1.1074 | 1.1132 | 1.1162 | 1.1220 | 1.1250 | 1.1308 |
| Camarilla | 1.1167 | 1.1175 | 1.1183 | 1.1191 | 1.1199 | 1.1207 | 1.1215 |
| Woodie | 1.1059 | 1.1081 | 1.1147 | 1.1169 | 1.1235 | 1.1257 | 1.1323 |
| Fibonacci | 1.1074 | 1.1107 | 1.1128 | 1.1162 | 1.1195 | 1.1216 | 1.1250 |
| Pivot points | S3 | S2 | S1 | PP | R1 | R2 | R3 |
|---|---|---|---|---|---|---|---|
| Standard | 1.0970 | 1.1019 | 1.1091 | 1.1140 | 1.1212 | 1.1261 | 1.1333 |
| Camarilla | 1.1130 | 1.1141 | 1.1152 | 1.1163 | 1.1174 | 1.1185 | 1.1196 |
| Woodie | 1.0982 | 1.1025 | 1.1103 | 1.1146 | 1.1224 | 1.1267 | 1.1345 |
| Fibonacci | 1.1019 | 1.1065 | 1.1094 | 1.1140 | 1.1186 | 1.1215 | 1.1261 |
| Pivot points | S3 | S2 | S1 | PP | R1 | R2 | R3 |
|---|---|---|---|---|---|---|---|
| Standard | 1.0390 | 1.0583 | 1.0815 | 1.1008 | 1.1240 | 1.1433 | 1.1665 |
| Camarilla | 1.0929 | 1.0968 | 1.1007 | 1.1046 | 1.1085 | 1.1124 | 1.1163 |
| Woodie | 1.0409 | 1.0593 | 1.0834 | 1.1018 | 1.1259 | 1.1443 | 1.1684 |
| Fibonacci | 1.0583 | 1.0746 | 1.0846 | 1.1008 | 1.1171 | 1.1271 | 1.1433 |
Numerical data
The following is the status of technical indicators and moving averages registered at the time this technical analysis was created:
| RSI (14): | 62.67 | |
| MACD (12,26,9): | 0.0039 | |
| Directional Movement: | 7.1452 | |
| AROON (14): | 71.4286 | |
| DEMA (21): | 1.1161 | |
| Parabolic SAR (0,02-0,02-0,2): | 1.1061 | |
| Elder Ray (13): | 0.0063 | |
| Super Trend (3,10): | 1.1007 | |
| Zig ZAG (10): | 1.1195 | |
| VORTEX (21): | 1.0260 | |
| Stochastique (14,3,5): | 85.42 | |
| TEMA (21): | 1.1161 | |
| Williams %R (14): | -2.03 | |
| Chande Momentum Oscillator (20): | 0.0160 | |
| Repulse (5,40,3): | 0.6487 | |
| ROCnROLL: | 1 | |
| TRIX (15,9): | 0.0429 | |
| Courbe Coppock: | 1.38 |
| MA7: | 1.1151 | |
| MA20: | 1.1096 | |
| MA50: | 1.1017 | |
| MA100: | 1.0912 | |
| MAexp7: | 1.1152 | |
| MAexp20: | 1.1109 | |
| MAexp50: | 1.1032 | |
| MAexp100: | 1.0954 | |
| Price / MA7: | +0.38% | |
| Price / MA20: | +0.87% | |
| Price / MA50: | +1.60% | |
| Price / MA100: | +2.58% | |
| Price / MAexp7: | +0.37% | |
| Price / MAexp20: | +0.76% | |
| Price / MAexp50: | +1.46% | |
| Price / MAexp100: | +2.18% |
News
The last news published on EUR/USD at the time of the generation of this analysis was as follows:
-
 EUR/USD Forecast September 19, 2024
-
Euro Continues to Look to The Fed: EUR/USD Technical Analysis by Chris Lewis (09/18)
-
EUR/USD Forecast September 17, 2024
-
Weekly Technical Outlook on USDJPY, EURUSD and GBPUSD
-
Euro Sees Buyers on Dips: EUR/USD Technical Analysis by Chris Lewis for FX Empire (09/16)
About author

Online


Add a comment
Comments
0 comments on the analysis EUR/USD - Daily