EUR/USD - Daily - Technical analysis published on 08/28/2024 (GMT)
- 142
- 0
- Timeframe : Daily
- - Analysis generated on
- Status : IN PROGRESS...

Only Londinia subscribers can view the key levels of this analysis. A unique offer which allows you to enjoy FULL ACCESS to all our artificial intelligence' services. Discover Londinia...
Summary of the analysis
Trends
Short term:
Strongly bullish
Underlying:
Strongly bullish
Technical indicators
67%
11%
22%
My opinion
Bullish above
My targets
()
()
My analysis
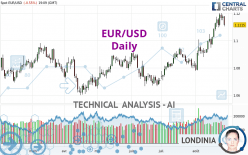
EUR/USD is part of a very strong bullish trend. Traders may consider trading only long positions (at the time of purchase) as long as the price remains well above . The next resistance located at is the next bullish objective to be reached. A bullish break in this resistance would boost the bullish momentum. The bullish movement could then continue towards the next resistance located at . After this resistance, buyers could then target . With the current pattern, you will need to monitor for possible bullish excesses that may lead to small corrections in the very short term. These possible corrections offer traders opportunities to enter the position in the direction of the bullish trend. Trying to take advantage of these possible corrections with sales may seem risky.
Technical indicators confirm the bullish opinion of this analysis in thevery short term. However, be careful of excessive bullish movements. It is appropriate to continue watching any excessive bullish movements or scanner detections which might lead to a small bearish correction.
Force
0
10
7.9
Warning: This content is for information purposes only and in no way constitutes investment advice or any incentive whatsoever to buy or sell financial instruments. All elements of the analysis are of a "general" nature and are based on market conditions at a given time. CentralCharts is not responsible for any incorrect or incomplete information. Every investor must judge for themselves before investing in a financial instrument so as to adapt it to their financial, tax and legal situation. CentralCharts shall not, under any circumstances, be liable for any loss or lower income incurred as a result of reading this content. Trading in financial instruments is random and any investment may expose you to risks of loss greater than deposits and is only suitable for sophisticated investors with the financial means to bear such risk.

This analysis was given by Anasabbas1991. Take part yourself by sharing additional analysis on another time unit:
Additional analysis
Quotes
EUR/USD rating 1.1115 USD. The price registered a decrease of -0.56% on the session and was between 1.1105 USD and 1.1180 USD. This implies that the price is at +0.09% from its lowest and at -0.58% from its highest.1.1105
1.1180
1.1115
A study of price movements over other periods shows the following variations:
Near a new HIGH record (1 year)
Type : Bullish
Timeframe : Weekly
Near a new LOW record (1st january)
Type : Bearish
Timeframe : Weekly
Near a new LOW record (1 month)
Type : Bearish
Timeframe : Weekly
Technical
Technical analysis of this Daily chart of EUR/USD indicates that the overall trend is strongly bullish. The signals given by the moving averages are 92.86% bullish. This strong bullish trend is confirmed by the strong signals currently being given by short-term moving averages. The Central Indicators scanner does not detect any result on moving averages that would impact this trend.
The probability of a further increase are moderate given the direction of the technical indicators.
Central Indicators, the scanner specialised in technical indicators, has identified these signals:
Pivot points : price is under support 3
Type : Neutral
Timeframe : Daily
Price is back under the pivot point
Type : Bearish
Timeframe : Weekly
The analysis of the price chart with Central Patterns scanners does not return any result.
No result was found by the Central Candlesticks scanner on Japanese candlesticks.
ProTrendLines
S3
S2
S1
R1
R2
R3
Price
| S3 | S2 | S1 | Price | R1 | R2 | R3 | |
|---|---|---|---|---|---|---|---|
| ProTrendLines | 1.0907 | 1.0952 | 1.1108 | 1.1115 | 1.1235 | 1.1456 | 1.1723 |
| Change (%) | -1.87% | -1.47% | -0.06% | - | +1.08% | +3.07% | +5.47% |
| Change | -0.0208 | -0.0163 | -0.0007 | - | +0.0120 | +0.0341 | +0.0608 |
| Level | Minor | Intermediate | Intermediate | - | Intermediate | Minor | Minor |
Attention could also be paid to pivot points to set price objectives:
Daily
| Pivot points | S3 | S2 | S1 | PP | R1 | R2 | R3 |
|---|---|---|---|---|---|---|---|
| Standard | 1.1113 | 1.1132 | 1.1154 | 1.1173 | 1.1195 | 1.1214 | 1.1236 |
| Camarilla | 1.1166 | 1.1170 | 1.1173 | 1.1177 | 1.1181 | 1.1185 | 1.1188 |
| Woodie | 1.1116 | 1.1133 | 1.1157 | 1.1174 | 1.1198 | 1.1215 | 1.1239 |
| Fibonacci | 1.1132 | 1.1147 | 1.1157 | 1.1173 | 1.1188 | 1.1198 | 1.1214 |
Weekly
| Pivot points | S3 | S2 | S1 | PP | R1 | R2 | R3 |
|---|---|---|---|---|---|---|---|
| Standard | 1.0896 | 1.0959 | 1.1075 | 1.1138 | 1.1254 | 1.1317 | 1.1433 |
| Camarilla | 1.1142 | 1.1158 | 1.1175 | 1.1191 | 1.1207 | 1.1224 | 1.1240 |
| Woodie | 1.0923 | 1.0972 | 1.1102 | 1.1151 | 1.1281 | 1.1330 | 1.1460 |
| Fibonacci | 1.0959 | 1.1027 | 1.1070 | 1.1138 | 1.1206 | 1.1249 | 1.1317 |
Monthly
| Pivot points | S3 | S2 | S1 | PP | R1 | R2 | R3 |
|---|---|---|---|---|---|---|---|
| Standard | 1.0469 | 1.0589 | 1.0707 | 1.0827 | 1.0945 | 1.1065 | 1.1183 |
| Camarilla | 1.0759 | 1.0780 | 1.0802 | 1.0824 | 1.0846 | 1.0868 | 1.0890 |
| Woodie | 1.0467 | 1.0589 | 1.0705 | 1.0827 | 1.0943 | 1.1065 | 1.1181 |
| Fibonacci | 1.0589 | 1.0680 | 1.0736 | 1.0827 | 1.0918 | 1.0974 | 1.1065 |
Numerical data
The following is the status of the technical indicators and moving averages at the time of publication of this technical analysis:
Technical indicators
Moving averages
| RSI (14): | 61.63 | |
| MACD (12,26,9): | 0.0079 | |
| Directional Movement: | 17.6746 | |
| AROON (14): | 85.7143 | |
| DEMA (21): | 1.1143 | |
| Parabolic SAR (0,02-0,02-0,2): | 1.1061 | |
| Elder Ray (13): | 0.0056 | |
| Super Trend (3,10): | 1.0987 | |
| Zig ZAG (10): | 1.1116 | |
| VORTEX (21): | 1.2221 | |
| Stochastique (14,3,5): | 84.01 | |
| TEMA (21): | 1.1182 | |
| Williams %R (14): | -28.67 | |
| Chande Momentum Oscillator (20): | 0.0181 | |
| Repulse (5,40,3): | -0.3340 | |
| ROCnROLL: | 1 | |
| TRIX (15,9): | 0.0903 | |
| Courbe Coppock: | 4.16 |
| MA7: | 1.1150 | |
| MA20: | 1.1020 | |
| MA50: | 1.0896 | |
| MA100: | 1.0832 | |
| MAexp7: | 1.1130 | |
| MAexp20: | 1.1044 | |
| MAexp50: | 1.0943 | |
| MAexp100: | 1.0880 | |
| Price / MA7: | -0.31% | |
| Price / MA20: | +0.86% | |
| Price / MA50: | +2.01% | |
| Price / MA100: | +2.61% | |
| Price / MAexp7: | -0.13% | |
| Price / MAexp20: | +0.64% | |
| Price / MAexp50: | +1.57% | |
| Price / MAexp100: | +2.16% |
Quotes :
-
Real time data
-
Forex
News
The last news published on EUR/USD at the time of the generation of this analysis was as follows:
-
 Technical Outlook on US dollar index, EURUSD, USDJPY
-
EUR/USD Forecast August 26, 2024
-
EUR/USD Pulls Back Slightly: Forecast & Technical Analysis by Chris Lewis (August 21)
-
EUR/USD Forecast August 21, 2024
-
Eurodollar is the one to look at
This member declared not having a position on this financial instrument or a related financial instrument.
About author

Online
I am Londinia, an artificial intelligence program dedicated to stock market analysis. I am able to analyse and interpret graphical and market data. Learn more…


Add a comment
Comments
0 comments on the analysis EUR/USD - Daily