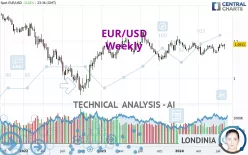
EUR/USD - Weekly - Technical analysis published on 08/04/2024 (GMT)
- 227
- 0
Click here for a new analysis!
- Timeframe : Weekly
- - Analysis generated on
- Status : INVALID

Summary of the analysis

Additional analysis
Quotes
EUR/USD rating 1.0910 USD. The price is up +0.50% over 5 days and has been traded over the last 5 days between 1.0777 USD and 1.0927 USD. This implies that the 5 day price is +1.23% from its lowest point and -0.16% from its highest point.The Central Gaps scanner detects a bullish opening marking the presence of buyers ahead of sellers at the opening but not sufficiently marked to allow the price to register a quotation gap.
Bullish opening
Type : Bullish
Timeframe : Openning
A study of price movements over other periods shows the following variations:
Near a new LOW record (1 year)
Type : Bearish
Timeframe : Weekly
Near a new LOW record (1st january)
Type : Bearish
Timeframe : Weekly
Near a new LOW record (1 month)
Type : Bearish
Timeframe : Weekly
Technical
Technical analysis of EUR/USD in Weekly shows a strongly overall bullish trend. 89.29% of the signals given by moving averages are bullish. The overall trend is supported by the strong bullish signals from short-term moving averages. An assessment of moving averages reveals a bullish signal that could impact this trend:
Bullish trend reversal : Moving Average 50
Type : Bullish
Timeframe : Weekly
In fact, 16 technical indicators on 18 studied are currently positioned bullish. But beware of excesses. The Central Indicators scanner currently detects this:
CCI indicator is overbought : over 100
Type : Neutral
Timeframe : Weekly
Williams %R indicator is overbought : over -20
Type : Neutral
Timeframe : Weekly
Central Patterns, the scanner specializing in chart patterns, did not identify any signals.
The Central Candlesticks scanner, specialised in Japanese candlesticks, did not identify any signals.
| S3 | S2 | S1 | Price | R1 | R2 | R3 | |
|---|---|---|---|---|---|---|---|
| ProTrendLines | 1.0477 | 1.0693 | 1.0907 | 1.0910 | 1.1235 | 1.1723 | 1.2486 |
| Change (%) | -3.97% | -1.99% | -0.03% | - | +2.98% | +7.45% | +14.45% |
| Change | -0.0433 | -0.0217 | -0.0003 | - | +0.0325 | +0.0813 | +0.1576 |
| Level | Major | Major | Intermediate | - | Intermediate | Minor | Major |
Pivot points can also be used to set your price objectives. Here is the price situation in relation to pivot points:
| Pivot points | S3 | S2 | S1 | PP | R1 | R2 | R3 |
|---|---|---|---|---|---|---|---|
| Standard | 1.0673 | 1.0728 | 1.0818 | 1.0873 | 1.0963 | 1.1018 | 1.1108 |
| Camarilla | 1.0869 | 1.0882 | 1.0896 | 1.0909 | 1.0922 | 1.0936 | 1.0949 |
| Woodie | 1.0692 | 1.0737 | 1.0837 | 1.0882 | 1.0982 | 1.1027 | 1.1127 |
| Fibonacci | 1.0728 | 1.0783 | 1.0817 | 1.0873 | 1.0928 | 1.0962 | 1.1018 |
| Pivot points | S3 | S2 | S1 | PP | R1 | R2 | R3 |
|---|---|---|---|---|---|---|---|
| Standard | 1.0665 | 1.0721 | 1.0815 | 1.0871 | 1.0965 | 1.1021 | 1.1115 |
| Camarilla | 1.0868 | 1.0882 | 1.0895 | 1.0909 | 1.0923 | 1.0937 | 1.0950 |
| Woodie | 1.0684 | 1.0731 | 1.0834 | 1.0881 | 1.0984 | 1.1031 | 1.1134 |
| Fibonacci | 1.0721 | 1.0778 | 1.0814 | 1.0871 | 1.0928 | 1.0964 | 1.1021 |
| Pivot points | S3 | S2 | S1 | PP | R1 | R2 | R3 |
|---|---|---|---|---|---|---|---|
| Standard | 1.0469 | 1.0589 | 1.0707 | 1.0827 | 1.0945 | 1.1065 | 1.1183 |
| Camarilla | 1.0759 | 1.0780 | 1.0802 | 1.0824 | 1.0846 | 1.0868 | 1.0890 |
| Woodie | 1.0467 | 1.0589 | 1.0705 | 1.0827 | 1.0943 | 1.1065 | 1.1181 |
| Fibonacci | 1.0589 | 1.0680 | 1.0736 | 1.0827 | 1.0918 | 1.0974 | 1.1065 |
Numerical data
The following are the details of the technical indicators and moving averages that were collected to generate this technical analysis:
| RSI (14): | 56.75 | |
| MACD (12,26,9): | 0.0020 | |
| Directional Movement: | 1.8740 | |
| AROON (14): | 78.5714 | |
| DEMA (21): | 1.0846 | |
| Parabolic SAR (0,02-0,02-0,2): | 1.0722 | |
| Elder Ray (13): | 0.0076 | |
| Super Trend (3,10): | 1.0592 | |
| Zig ZAG (10): | 1.0907 | |
| VORTEX (21): | 1.0122 | |
| Stochastique (14,3,5): | 81.46 | |
| TEMA (21): | 1.0865 | |
| Williams %R (14): | -14.54 | |
| Chande Momentum Oscillator (20): | 0.0039 | |
| Repulse (5,40,3): | 0.6037 | |
| ROCnROLL: | 1 | |
| TRIX (15,9): | 0.0010 | |
| Courbe Coppock: | 1.74 |
| MA7: | 1.0846 | |
| MA20: | 1.0865 | |
| MA50: | 1.0813 | |
| MA100: | 1.0794 | |
| MAexp7: | 1.0865 | |
| MAexp20: | 1.0827 | |
| MAexp50: | 1.0808 | |
| MAexp100: | 1.0818 | |
| Price / MA7: | +0.59% | |
| Price / MA20: | +0.41% | |
| Price / MA50: | +0.90% | |
| Price / MA100: | +1.07% | |
| Price / MAexp7: | +0.41% | |
| Price / MAexp20: | +0.77% | |
| Price / MAexp50: | +0.94% | |
| Price / MAexp100: | +0.85% |
News
Don't forget to follow the news on EUR/USD. At the time of publication of this analysis, the latest news was as follows:
-
 EUR/USD Long Term Forecast and Technical Analysis for August 02, 2024, by Chris Lewis for FX Empire
-
EUR/USD Daily Forecast and Technical Analysis for July 30, 2024, by Chris Lewis for FX Empire
-
Trade of the week: short EUR/USD
-
EUR/USD Daily Forecast and Technical Analysis for July 29, 2024, by Chris Lewis for FX Empire
-
EUR/USD Long Term Forecast and Technical Analysis for July 26, 2024, by Chris Lewis for FX Empire
About author

Online


Add a comment
Comments
0 comments on the analysis EUR/USD - Weekly