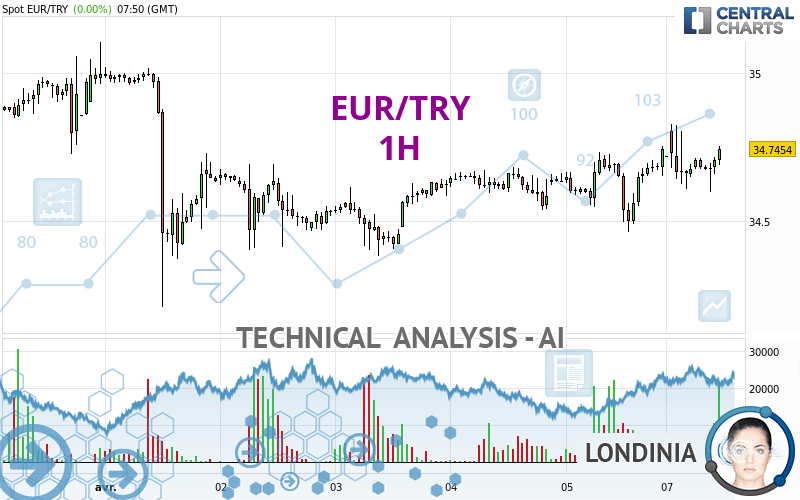
EUR/TRY - 1H - Technical analysis published on 04/08/2024 (GMT)
- 105
- 0
Click here for a new analysis!
- Timeframe : 1H
- - Analysis generated on
- Status : TARGET REACHED

Summary of the analysis

Additional analysis
Quotes
The EUR/TRY rating is 34.7454 TRY. The price registered an increase of +0.00% on the session and was between 34.5988 TRY and 34.8295 TRY. This implies that the price is at +0.42% from its lowest and at -0.24% from its highest.A bearish opening was detected by the Central Gaps scanner. Sellers are trying to impose a bearish trend in the very short term.
Bearish opening
Type : Bearish
Timeframe : Openning
Here is a more detailed summary of the historical variations registered by EUR/TRY:
Near a new HIGH record (5 years)
Type : Bullish
Timeframe : Weekly
Near a new HIGH record (1 year)
Type : Bullish
Timeframe : Weekly
Near a new HIGH record (1st january)
Type : Bullish
Timeframe : Weekly
Near a new HIGH record (1 month)
Type : Bullish
Timeframe : Weekly
The Central Volumes scanner detects abnormal volumes on the asset:
Abnormal volumes
Timeframe : 5 days
Abnormal volumes
Timeframe : 20 days
Abnormal volumes
Timeframe : 50 days
Technical
Technical analysis of this 1H chart of EUR/TRY indicates that the overall trend is strongly bullish. 89.29% of the signals given by moving averages are bullish. The overall trend is supported by the strong bullish signals from short-term moving averages. An assessment of moving averages reveals a bullish signal that could impact this trend:
Bullish trend reversal : Moving Average 20
Type : Bullish
Timeframe : 1 hour
In fact, 13 technical indicators on 18 studied are currently bullish. Central Indicators, the scanner specialised in technical indicators, has identified these signals:
MACD crosses UP its Moving Average
Type : Bullish
Timeframe : 1 hour
Price is back over the pivot point
Type : Bullish
Timeframe : 1 hour
Momentum indicator is back under 0
Type : Bearish
Timeframe : 1 hour
Williams %R indicator is back over -50
Type : Bullish
Timeframe : 1 hour
Central Patterns, the scanner specializing in chart patterns, did not identify any signals.
There is also a Japanese candlestick pattern detected by Central Candlesticks that could mark the end of the current short-term trend:
Doji
Type : Neutral
Timeframe : 1 hour
| S3 | S2 | S1 | Price | R1 | R2 | R3 | |
|---|---|---|---|---|---|---|---|
| ProTrendLines | 34.5333 | 34.6197 | 34.7318 | 34.7454 | 34.8314 | 34.9944 | 35.1055 |
| Change (%) | -0.61% | -0.36% | -0.04% | - | +0.25% | +0.72% | +1.04% |
| Change | -0.2121 | -0.1257 | -0.0136 | - | +0.0860 | +0.2490 | +0.3601 |
| Level | Intermediate | Minor | Major | - | Intermediate | Minor | Intermediate |
Attention could also be paid to pivot points to set price objectives:
| Pivot points | S3 | S2 | S1 | PP | R1 | R2 | R3 |
|---|---|---|---|---|---|---|---|
| Standard | 34.2639 | 34.3638 | 34.5544 | 34.6543 | 34.8449 | 34.9448 | 35.1354 |
| Camarilla | 34.6651 | 34.6917 | 34.7184 | 34.7450 | 34.7716 | 34.7983 | 34.8249 |
| Woodie | 34.3093 | 34.3865 | 34.5998 | 34.6770 | 34.8903 | 34.9675 | 35.1808 |
| Fibonacci | 34.3638 | 34.4748 | 34.5433 | 34.6543 | 34.7653 | 34.8338 | 34.9448 |
| Pivot points | S3 | S2 | S1 | PP | R1 | R2 | R3 |
|---|---|---|---|---|---|---|---|
| Standard | 33.3748 | 33.7931 | 34.2690 | 34.6873 | 35.1632 | 35.5815 | 36.0574 |
| Camarilla | 34.4991 | 34.5811 | 34.6630 | 34.7450 | 34.8270 | 34.9089 | 34.9909 |
| Woodie | 33.4037 | 33.8075 | 34.2979 | 34.7017 | 35.1921 | 35.5959 | 36.0863 |
| Fibonacci | 33.7931 | 34.1347 | 34.3457 | 34.6873 | 35.0289 | 35.2399 | 35.5815 |
| Pivot points | S3 | S2 | S1 | PP | R1 | R2 | R3 |
|---|---|---|---|---|---|---|---|
| Standard | 31.8970 | 32.8568 | 33.8579 | 34.8177 | 35.8188 | 36.7786 | 37.7797 |
| Camarilla | 34.3199 | 34.4996 | 34.6794 | 34.8591 | 35.0389 | 35.2186 | 35.3984 |
| Woodie | 31.9178 | 32.8671 | 33.8787 | 34.8280 | 35.8396 | 36.7889 | 37.8005 |
| Fibonacci | 32.8568 | 33.6058 | 34.0686 | 34.8177 | 35.5667 | 36.0295 | 36.7786 |
Numerical data
The following is the status of the technical indicators and moving averages at the time of publication of this technical analysis:
| RSI (14): | 56.77 | |
| MACD (12,26,9): | 0.0168 | |
| Directional Movement: | 5.7468 | |
| AROON (14): | -57.1429 | |
| DEMA (21): | 34.7022 | |
| Parabolic SAR (0,02-0,02-0,2): | 34.8204 | |
| Elder Ray (13): | 0.0340 | |
| Super Trend (3,10): | 34.5397 | |
| Zig ZAG (10): | 34.7204 | |
| VORTEX (21): | 1.0090 | |
| Stochastique (14,3,5): | 43.30 | |
| TEMA (21): | 34.7058 | |
| Williams %R (14): | -42.52 | |
| Chande Momentum Oscillator (20): | -0.0119 | |
| Repulse (5,40,3): | 0.2045 | |
| ROCnROLL: | 1 | |
| TRIX (15,9): | 0.0070 | |
| Courbe Coppock: | 0.24 |
| MA7: | 34.6816 | |
| MA20: | 34.9032 | |
| MA50: | 34.0936 | |
| MA100: | 33.1144 | |
| MAexp7: | 34.7007 | |
| MAexp20: | 34.6804 | |
| MAexp50: | 34.6541 | |
| MAexp100: | 34.6550 | |
| Price / MA7: | +0.18% | |
| Price / MA20: | -0.45% | |
| Price / MA50: | +1.91% | |
| Price / MA100: | +4.93% | |
| Price / MAexp7: | +0.13% | |
| Price / MAexp20: | +0.19% | |
| Price / MAexp50: | +0.27% | |
| Price / MAexp100: | +0.26% |
News
Don't forget to follow the news on EUR/TRY. At the time of publication of this analysis, the latest news was as follows:
About author
Online


Add a comment
Comments
0 comments on the analysis EUR/TRY - 1H