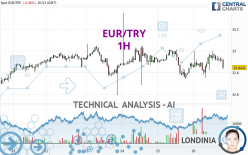
EUR/TRY - 1H - Technical analysis published on 01/26/2024 (GMT)
- 107
- 0
- Timeframe : 1H
- - Analysis generated on
- Status : NEUTRAL

Summary of the analysis

Additional analysis
Quotes
The EUR/TRY rating is 32.8441 TRY. The price is lower by -0.06% since the last closing and was traded between 32.7499 TRY and 32.9989 TRY over the period. The price is currently at +0.29% from its lowest and -0.47% from its highest.A bullish opening was detected by the Central Gaps scanner. Buyers are trying to impose a bullish momentum in the very short term.
Bullish opening
Type : Bullish
Timeframe : Openning
A study of price movements over other periods shows the following variations:
Near a new HIGH record (5 years)
Type : Bullish
Timeframe : Weekly
Near a new HIGH record (1 year)
Type : Bullish
Timeframe : Weekly
Near a new HIGH record (1st january)
Type : Bullish
Timeframe : Weekly
Near a new HIGH record (1 month)
Type : Bullish
Timeframe : Weekly
Technical
A technical analysis in 1H of this EUR/TRY chart shows a neutral trend. The slightly bearish signals currently given by short-term moving averages could allow the overall trend to return to a slightly bearish trend. The Central Indicators market scanner is currently detecting several bearish and bullish signals that could impact this trend:
Bullish trend reversal : Moving Average 50
Type : Bullish
Timeframe : 1 hour
Moving Average bullish crossovers : MA20 & MA50
Type : Bullish
Timeframe : 1 hour
Bearish price crossover with Moving Average 20
Type : Bearish
Timeframe : 1 hour
Bearish price crossover with Moving Average 100
Type : Bearish
Timeframe : 1 hour
Bearish price crossover with adaptative moving average 50
Type : Bearish
Timeframe : 1 hour
Bearish price crossover with adaptative moving average 100
Type : Bearish
Timeframe : 1 hour
The technical indicators are generally neutral. They do not provide relevant information on the direction of future price movements.
The Central Indicators scanner specialised in technical indicators, has not detected anything further.
An analysis of the price chart with the Central Patterns scanner (detector of chart patterns and resistances and supports) shows a result that can have an impact on the price change:
Near resistance of triangle
Type : Bearish
Timeframe : 1 hour
The Central Candlesticks scanner, specialised in Japanese candlesticks, did not identify any signals.
| S3 | S2 | S1 | Price | R1 | R2 | R3 | |
|---|---|---|---|---|---|---|---|
| ProTrendLines | 32.5915 | 32.6855 | 32.7986 | 32.8441 | 32.8710 | 33.0210 | 33.0898 |
| Change (%) | -0.77% | -0.48% | -0.14% | - | +0.08% | +0.54% | +0.75% |
| Change | -0.2526 | -0.1586 | -0.0455 | - | +0.0269 | +0.1769 | +0.2457 |
| Level | Minor | Intermediate | Minor | - | Minor | Major | Minor |
Pivot points can also be used to set your price objectives. Here is the price situation in relation to pivot points:
| Pivot points | S3 | S2 | S1 | PP | R1 | R2 | R3 |
|---|---|---|---|---|---|---|---|
| Standard | 32.4548 | 32.5971 | 32.7300 | 32.8723 | 33.0052 | 33.1475 | 33.2804 |
| Camarilla | 32.7871 | 32.8124 | 32.8376 | 32.8628 | 32.8880 | 32.9133 | 32.9385 |
| Woodie | 32.4500 | 32.5948 | 32.7252 | 32.8700 | 33.0004 | 33.1452 | 33.2756 |
| Fibonacci | 32.5971 | 32.7023 | 32.7672 | 32.8723 | 32.9775 | 33.0424 | 33.1475 |
| Pivot points | S3 | S2 | S1 | PP | R1 | R2 | R3 |
|---|---|---|---|---|---|---|---|
| Standard | 32.2318 | 32.4400 | 32.6734 | 32.8816 | 33.1150 | 33.3232 | 33.5566 |
| Camarilla | 32.7854 | 32.8258 | 32.8663 | 32.9068 | 32.9473 | 32.9878 | 33.0282 |
| Woodie | 32.2444 | 32.4463 | 32.6860 | 32.8879 | 33.1276 | 33.3295 | 33.5692 |
| Fibonacci | 32.4400 | 32.6087 | 32.7129 | 32.8816 | 33.0503 | 33.1545 | 33.3232 |
| Pivot points | S3 | S2 | S1 | PP | R1 | R2 | R3 |
|---|---|---|---|---|---|---|---|
| Standard | 29.6071 | 30.3359 | 31.4406 | 32.1694 | 33.2741 | 34.0029 | 35.1076 |
| Camarilla | 32.0411 | 32.2092 | 32.3772 | 32.5453 | 32.7134 | 32.8814 | 33.0495 |
| Woodie | 29.7951 | 30.4299 | 31.6286 | 32.2634 | 33.4621 | 34.0969 | 35.2956 |
| Fibonacci | 30.3359 | 31.0363 | 31.4690 | 32.1694 | 32.8698 | 33.3025 | 34.0029 |
Numerical data
The following are the details of the technical indicators and moving averages that were collected to generate this technical analysis:
| RSI (14): | 49.62 | |
| MACD (12,26,9): | 0.0103 | |
| Directional Movement: | 1.1692 | |
| AROON (14): | 35.7143 | |
| DEMA (21): | 32.9159 | |
| Parabolic SAR (0,02-0,02-0,2): | 32.7827 | |
| Elder Ray (13): | 0.0005 | |
| Super Trend (3,10): | 32.7486 | |
| Zig ZAG (10): | 32.9056 | |
| VORTEX (21): | 1.0393 | |
| Stochastique (14,3,5): | 63.73 | |
| TEMA (21): | 32.9292 | |
| Williams %R (14): | -39.44 | |
| Chande Momentum Oscillator (20): | 0.0464 | |
| Repulse (5,40,3): | -0.3179 | |
| ROCnROLL: | 2 | |
| TRIX (15,9): | 0.0039 | |
| Courbe Coppock: | 0.31 |
| MA7: | 32.8781 | |
| MA20: | 32.7966 | |
| MA50: | 32.0997 | |
| MA100: | 30.7970 | |
| MAexp7: | 32.9010 | |
| MAexp20: | 32.9050 | |
| MAexp50: | 32.8994 | |
| MAexp100: | 32.8983 | |
| Price / MA7: | -0.10% | |
| Price / MA20: | +0.14% | |
| Price / MA50: | +2.32% | |
| Price / MA100: | +6.65% | |
| Price / MAexp7: | -0.17% | |
| Price / MAexp20: | -0.19% | |
| Price / MAexp50: | -0.17% | |
| Price / MAexp100: | -0.16% |
News
The latest news and videos published on EUR/TRY at the time of the analysis were as follows:
About author
Online


Add a comment
Comments
0 comments on the analysis EUR/TRY - 1H