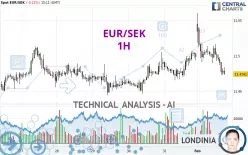
EUR/SEK - 1H - Technical analysis published on 02/03/2025 (GMT)
- 123
- 0
Click here for a new analysis!
- Timeframe : 1H
- - Analysis generated on
- Status : TARGET REACHED

Summary of the analysis

Additional analysis
Quotes
The EUR/SEK price is 11.4740 SEK. The price is lower by -0.21% since the last closing and was traded between 11.4729 SEK and 11.5600 SEK over the period. The price is currently at +0.01% from its lowest and -0.74% from its highest.The Central Gaps scanner detects the formation of a bullish gap marking the strong presence of buyers against sellers at the opening. This formed a quotation gap.
Opening Gap UP
Type : Bullish
Timeframe : Openning
A study of price movements over other periods shows the following variations:
Near a new HIGH record (5 years)
Type : Bullish
Timeframe : Weekly
Near a new LOW record (1 year)
Type : Bearish
Timeframe : Weekly
New HIGH record (1st january)
Type : Bullish
Timeframe : Weekly
New HIGH record (1 month)
Type : Bullish
Timeframe : Weekly
Technical
Technical analysis of this 1H chart of EUR/SEK indicates that the overall trend is bearish. 71.43% of the signals given by moving averages are bearish. This bearish trend is supported by the strong bearish signals given by short-term moving averages. The Central Indicators market scanner is currently detecting a bullish signal that could impact this trend:
Bullish price crossover with Moving Average 100
Type : Bullish
Timeframe : 1 hour
In fact, 12 technical indicators on 18 studied are currently positioned bearish. Caution: the Central Indicators scanner currently detects an excess:
CCI indicator is oversold : under -100
Type : Neutral
Timeframe : 1 hour
Previous candle closed under Bollinger bands
Type : Neutral
Timeframe : 1 hour
Williams %R indicator is oversold : under -80
Type : Neutral
Timeframe : 1 hour
Price is back under the pivot point
Type : Bearish
Timeframe : Weekly
An analysis of the price chart with the Central Patterns scanner (detector of chart patterns and resistances and supports) shows several results that can have an impact on the price change:
Horizontal support is broken
Type : Bearish
Timeframe : 1 hour
Support of channel is broken
Type : Bearish
Timeframe : 1 hour
The Central Candlesticks scanner which studies Japanese candlesticks did not detect anything.
| S3 | S2 | S1 | Price | R1 | R2 | R3 | |
|---|---|---|---|---|---|---|---|
| ProTrendLines | 11.3830 | 11.4456 | 11.4657 | 11.4740 | 11.4795 | 11.4892 | 11.5052 |
| Change (%) | -0.79% | -0.25% | -0.07% | - | +0.05% | +0.13% | +0.27% |
| Change | -0.0910 | -0.0284 | -0.0083 | - | +0.0055 | +0.0152 | +0.0312 |
| Level | Minor | Major | Minor | - | Minor | Minor | Minor |
Pivot points can also be used to set your price objectives. Here is the price situation in relation to pivot points:
| Pivot points | S3 | S2 | S1 | PP | R1 | R2 | R3 |
|---|---|---|---|---|---|---|---|
| Standard | 11.4323 | 11.4489 | 11.4737 | 11.4903 | 11.5151 | 11.5317 | 11.5565 |
| Camarilla | 11.4870 | 11.4908 | 11.4946 | 11.4984 | 11.5022 | 11.5060 | 11.5098 |
| Woodie | 11.4363 | 11.4510 | 11.4777 | 11.4924 | 11.5191 | 11.5338 | 11.5605 |
| Fibonacci | 11.4489 | 11.4648 | 11.4745 | 11.4903 | 11.5062 | 11.5159 | 11.5317 |
| Pivot points | S3 | S2 | S1 | PP | R1 | R2 | R3 |
|---|---|---|---|---|---|---|---|
| Standard | 11.3891 | 11.4168 | 11.4576 | 11.4853 | 11.5261 | 11.5538 | 11.5946 |
| Camarilla | 11.4796 | 11.4858 | 11.4921 | 11.4984 | 11.5047 | 11.5110 | 11.5172 |
| Woodie | 11.3957 | 11.4201 | 11.4642 | 11.4886 | 11.5327 | 11.5571 | 11.6012 |
| Fibonacci | 11.4168 | 11.4430 | 11.4591 | 11.4853 | 11.5115 | 11.5276 | 11.5538 |
| Pivot points | S3 | S2 | S1 | PP | R1 | R2 | R3 |
|---|---|---|---|---|---|---|---|
| Standard | 11.3053 | 11.3592 | 11.4288 | 11.4827 | 11.5523 | 11.6062 | 11.6758 |
| Camarilla | 11.4644 | 11.4758 | 11.4871 | 11.4984 | 11.5097 | 11.5210 | 11.5324 |
| Woodie | 11.3132 | 11.3631 | 11.4367 | 11.4866 | 11.5602 | 11.6101 | 11.6837 |
| Fibonacci | 11.3592 | 11.4064 | 11.4355 | 11.4827 | 11.5299 | 11.5590 | 11.6062 |
Numerical data
The following is the status of technical indicators and moving averages registered at the time this technical analysis was created:
| RSI (14): | 37.67 | |
| MACD (12,26,9): | -0.0017 | |
| Directional Movement: | -4.1902 | |
| AROON (14): | -92.8571 | |
| DEMA (21): | 11.4949 | |
| Parabolic SAR (0,02-0,02-0,2): | 11.5196 | |
| Elder Ray (13): | -0.0173 | |
| Super Trend (3,10): | 11.5144 | |
| Zig ZAG (10): | 11.4755 | |
| VORTEX (21): | 0.8713 | |
| Stochastique (14,3,5): | 9.09 | |
| TEMA (21): | 11.4889 | |
| Williams %R (14): | -91.30 | |
| Chande Momentum Oscillator (20): | -0.0291 | |
| Repulse (5,40,3): | -0.1578 | |
| ROCnROLL: | 2 | |
| TRIX (15,9): | 0.0038 | |
| Courbe Coppock: | 0.30 |
| MA7: | 11.4754 | |
| MA20: | 11.4827 | |
| MA50: | 11.4969 | |
| MA100: | 11.4730 | |
| MAexp7: | 11.4884 | |
| MAexp20: | 11.4949 | |
| MAexp50: | 11.4900 | |
| MAexp100: | 11.4833 | |
| Price / MA7: | -0.01% | |
| Price / MA20: | -0.08% | |
| Price / MA50: | -0.20% | |
| Price / MA100: | +0.01% | |
| Price / MAexp7: | -0.13% | |
| Price / MAexp20: | -0.18% | |
| Price / MAexp50: | -0.14% | |
| Price / MAexp100: | -0.08% |
News
The latest news and videos published on EUR/SEK at the time of the analysis were as follows:
-
 EUR/SEK To Head Higher
-
Hows does more Riksbank QE impact USD/SEK and EUR/SEK ?
-
EUR/SEK to Grind Lower
-
Danske Bank On EUR/SEK
-
Nordea on EUR/SEK
About author

Online


Add a comment
Comments
0 comments on the analysis EUR/SEK - 1H