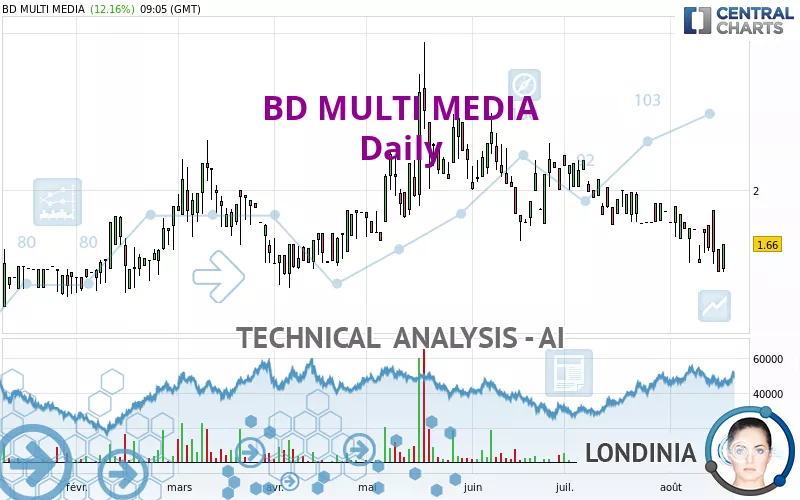
BD MULTI MEDIA - Daily - Technical analysis published on 08/21/2024 (GMT)
- 159
- 0
Click here for a new analysis!
- Timeframe : Daily
- - Analysis generated on
- Status : TARGET REACHED

Summary of the analysis

Additional analysis
Quotes
The BD MULTI MEDIA rating is 1.660 EUR. The price has increased by +12.16% since the last closing and was traded between 1.480 EUR and 1.660 EUR over the period. The price is currently at +12.16% from its lowest and 0% from its highest.A bullish opening was detected by the Central Gaps scanner. Buyers are trying to impose a bullish momentum in the very short term.
Bullish opening
Type : Bullish
Timeframe : Openning
A study of price movements over other periods shows the following variations:
New LOW record (1 month)
Type : Bearish
Timeframe : Weekly
Technical
Technical analysis of this Daily chart of BD MULTI MEDIA indicates that the overall trend is strongly bearish. 89.29% of the signals given by moving averages are bearish. This strongly bearish trend is supported by the strong bearish signals given by short-term moving averages. There is no crossing of moving average by the price or crossing of moving averages between themselves.
An assessment of technical indicators does not currently provide any relevant information on the direction of future price movements.
Caution: the Central Indicators scanner currently detects an excess:
CCI indicator is oversold : under -100
Type : Neutral
Timeframe : Daily
Previous candle closed under Bollinger bands
Type : Neutral
Timeframe : Daily
CCI indicator: bullish divergence
Type : Bullish
Timeframe : Daily
RSI indicator: bullish divergence
Type : Bullish
Timeframe : Daily
Pivot points : price is over resistance 1
Type : Neutral
Timeframe : Daily
An analysis of the price chart with the Central Patterns scanner (detector of chart patterns and resistances and supports) shows several results that can have an impact on the price change:
Near horizontal resistance
Type : Bearish
Timeframe : Daily
Near support of channel
Type : Bullish
Timeframe : Daily
The Central Candlesticks scanner which studies Japanese candlesticks did not detect anything.
| S2 | S1 | Price | R1 | R2 | R3 | |
|---|---|---|---|---|---|---|
| ProTrendLines | 1.019 | 1.559 | 1.660 | 1.786 | 2.170 | 2.620 |
| Change (%) | -38.61% | -6.08% | - | +7.59% | +30.72% | +57.83% |
| Change | -0.641 | -0.101 | - | +0.126 | +0.510 | +0.960 |
| Level | Major | Minor | - | Intermediate | Minor | Intermediate |
To determine price objectives, it is also possible to use the pivot points. Here is the price position in relation to pivot points:
| Pivot points | S3 | S2 | S1 | PP | R1 | R2 | R3 |
|---|---|---|---|---|---|---|---|
| Standard | 1.287 | 1.383 | 1.432 | 1.528 | 1.577 | 1.673 | 1.722 |
| Camarilla | 1.440 | 1.453 | 1.467 | 1.480 | 1.493 | 1.507 | 1.520 |
| Woodie | 1.263 | 1.371 | 1.408 | 1.516 | 1.553 | 1.661 | 1.698 |
| Fibonacci | 1.383 | 1.439 | 1.473 | 1.528 | 1.584 | 1.618 | 1.673 |
| Pivot points | S3 | S2 | S1 | PP | R1 | R2 | R3 |
|---|---|---|---|---|---|---|---|
| Standard | 1.275 | 1.405 | 1.520 | 1.650 | 1.765 | 1.895 | 2.010 |
| Camarilla | 1.568 | 1.590 | 1.613 | 1.635 | 1.658 | 1.680 | 1.702 |
| Woodie | 1.268 | 1.401 | 1.513 | 1.646 | 1.758 | 1.891 | 2.003 |
| Fibonacci | 1.405 | 1.499 | 1.556 | 1.650 | 1.744 | 1.801 | 1.895 |
| Pivot points | S3 | S2 | S1 | PP | R1 | R2 | R3 |
|---|---|---|---|---|---|---|---|
| Standard | 1.253 | 1.517 | 1.693 | 1.957 | 2.133 | 2.397 | 2.573 |
| Camarilla | 1.749 | 1.789 | 1.830 | 1.870 | 1.910 | 1.951 | 1.991 |
| Woodie | 1.210 | 1.495 | 1.650 | 1.935 | 2.090 | 2.375 | 2.530 |
| Fibonacci | 1.517 | 1.685 | 1.789 | 1.957 | 2.125 | 2.229 | 2.397 |
Numerical data
The following is the status of the technical indicators and moving averages at the time of publication of this technical analysis:
| RSI (14): | 44.53 | |
| MACD (12,26,9): | -0.0970 | |
| Directional Movement: | -3.603 | |
| AROON (14): | -92.857 | |
| DEMA (21): | 1.629 | |
| Parabolic SAR (0,02-0,02-0,2): | 1.875 | |
| Elder Ray (13): | -0.128 | |
| Super Trend (3,10): | 2.002 | |
| Zig ZAG (10): | 1.660 | |
| VORTEX (21): | 0.7860 | |
| Stochastique (14,3,5): | 20.47 | |
| TEMA (21): | 1.582 | |
| Williams %R (14): | -59.09 | |
| Chande Momentum Oscillator (20): | -0.210 | |
| Repulse (5,40,3): | -5.1560 | |
| ROCnROLL: | 2 | |
| TRIX (15,9): | -0.6210 | |
| Courbe Coppock: | 23.09 |
| MA7: | 1.632 | |
| MA20: | 1.771 | |
| MA50: | 1.929 | |
| MA100: | 1.917 | |
| MAexp7: | 1.641 | |
| MAexp20: | 1.751 | |
| MAexp50: | 1.864 | |
| MAexp100: | 1.885 | |
| Price / MA7: | +1.72% | |
| Price / MA20: | -6.27% | |
| Price / MA50: | -13.95% | |
| Price / MA100: | -13.41% | |
| Price / MAexp7: | +1.16% | |
| Price / MAexp20: | -5.20% | |
| Price / MAexp50: | -10.94% | |
| Price / MAexp100: | -11.94% |
News
The latest news and videos published on BD MULTI MEDIA at the time of the analysis were as follows:
- Launch of OLYMP Crypto Token and Olympus Game
- Acquisition of a majority stake in Olympus Crypto P2E Game
- OLYMPUS GAME - Limited sale of NFT and launch of its marketplace
- The first playable NFTs of Olympus Game to be launched on Sept. 24th
- Olympus Game to raise over 300K USD in the first ICO round
About author
Online


Add a comment
Comments
0 comments on the analysis BD MULTI MEDIA - Daily