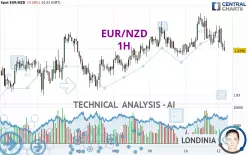
EUR/NZD - 1H - Technical analysis published on 01/13/2025 (GMT)
- 121
- 0
Click here for a new analysis!
- Timeframe : 1H
- - Analysis generated on
- Status : LEVEL MAINTAINED

Summary of the analysis

Additional analysis
Quotes
The EUR/NZD price is 1.8397 NZD. The price is lower by -0.08% since the last closing and was between 1.8395 NZD and 1.8418 NZD. This implies that the price is at +0.01% from its lowest and at -0.11% from its highest.Here is a more detailed summary of the historical variations registered by EUR/NZD:
Near a new HIGH record (1 year)
Type : Bullish
Timeframe : Weekly
Near a new HIGH record (1st january)
Type : Bullish
Timeframe : Weekly
Near a new LOW record (1 month)
Type : Bearish
Timeframe : Weekly
Technical
Technical analysis of EUR/NZD in 1H shows an overall bearish trend. 67.86% of the signals given by moving averages are bearish. The overall trend is reinforced by the strong bearish signals from short-term moving averages. The Central Indicators scanner detects bullish and bearish signals on moving averages that could impact this trend:
Bearish trend reversal : adaptative moving average 100
Type : Bearish
Timeframe : 1 hour
Bullish price crossover with adaptative moving average 50
Type : Bullish
Timeframe : 1 hour
In fact, 15 technical indicators on 18 studied are currently positioned bearish. But beware of excesses. The Central Indicators scanner currently detects this:
CCI indicator is oversold : under -100
Type : Neutral
Timeframe : 1 hour
Ichimoku : price is over the cloud
Type : Bullish
Timeframe : 1 hour
MACD indicator is back under 0
Type : Bearish
Timeframe : 1 hour
Central Patterns, the market scanner focusing on chart patterns, resistances and supports found these results:
Near horizontal support
Type : Bullish
Timeframe : 1 hour
Support of channel is broken
Type : Bearish
Timeframe : 1 hour
No result was found by the Central Candlesticks scanner on Japanese candlesticks.
| S3 | S2 | S1 | Price | R1 | R2 | R3 | |
|---|---|---|---|---|---|---|---|
| ProTrendLines | 1.8310 | 1.8342 | 1.8383 | 1.8397 | 1.8443 | 1.8478 | 1.8527 |
| Change (%) | -0.47% | -0.30% | -0.08% | - | +0.25% | +0.44% | +0.71% |
| Change | -0.0087 | -0.0055 | -0.0014 | - | +0.0046 | +0.0081 | +0.0130 |
| Level | Minor | Minor | Major | - | Major | Major | Major |
To determine price objectives, it is also possible to use the pivot points. Here is the price position in relation to pivot points:
| Pivot points | S3 | S2 | S1 | PP | R1 | R2 | R3 |
|---|---|---|---|---|---|---|---|
| Standard | 1.8344 | 1.8373 | 1.8392 | 1.8421 | 1.8440 | 1.8469 | 1.8488 |
| Camarilla | 1.8398 | 1.8402 | 1.8407 | 1.8411 | 1.8415 | 1.8420 | 1.8424 |
| Woodie | 1.8339 | 1.8371 | 1.8387 | 1.8419 | 1.8435 | 1.8467 | 1.8483 |
| Fibonacci | 1.8373 | 1.8391 | 1.8403 | 1.8421 | 1.8439 | 1.8451 | 1.8469 |
| Pivot points | S3 | S2 | S1 | PP | R1 | R2 | R3 |
|---|---|---|---|---|---|---|---|
| Standard | 1.8152 | 1.8226 | 1.8331 | 1.8405 | 1.8510 | 1.8584 | 1.8689 |
| Camarilla | 1.8388 | 1.8404 | 1.8421 | 1.8437 | 1.8453 | 1.8470 | 1.8486 |
| Woodie | 1.8169 | 1.8234 | 1.8348 | 1.8413 | 1.8527 | 1.8592 | 1.8706 |
| Fibonacci | 1.8226 | 1.8294 | 1.8336 | 1.8405 | 1.8473 | 1.8515 | 1.8584 |
| Pivot points | S3 | S2 | S1 | PP | R1 | R2 | R3 |
|---|---|---|---|---|---|---|---|
| Standard | 1.7256 | 1.7521 | 1.8012 | 1.8277 | 1.8768 | 1.9033 | 1.9524 |
| Camarilla | 1.8294 | 1.8363 | 1.8433 | 1.8502 | 1.8571 | 1.8641 | 1.8710 |
| Woodie | 1.7368 | 1.7578 | 1.8124 | 1.8334 | 1.8880 | 1.9090 | 1.9636 |
| Fibonacci | 1.7521 | 1.7810 | 1.7989 | 1.8277 | 1.8566 | 1.8745 | 1.9033 |
Numerical data
The following is the status of technical indicators and moving averages registered at the time this technical analysis was created:
| RSI (14): | 44.83 | |
| MACD (12,26,9): | -0.0001 | |
| Directional Movement: | -4.0560 | |
| AROON (14): | -85.7142 | |
| DEMA (21): | 1.8425 | |
| Parabolic SAR (0,02-0,02-0,2): | 1.8447 | |
| Elder Ray (13): | -0.0017 | |
| Super Trend (3,10): | 1.8482 | |
| Zig ZAG (10): | 1.8409 | |
| VORTEX (21): | 0.9982 | |
| Stochastique (14,3,5): | 15.40 | |
| TEMA (21): | 1.8419 | |
| Williams %R (14): | -84.00 | |
| Chande Momentum Oscillator (20): | -0.0015 | |
| Repulse (5,40,3): | -0.0623 | |
| ROCnROLL: | 2 | |
| TRIX (15,9): | 0.0027 | |
| Courbe Coppock: | 0.24 |
| MA7: | 1.8405 | |
| MA20: | 1.8403 | |
| MA50: | 1.8157 | |
| MA100: | 1.8022 | |
| MAexp7: | 1.8415 | |
| MAexp20: | 1.8424 | |
| MAexp50: | 1.8417 | |
| MAexp100: | 1.8408 | |
| Price / MA7: | -0.04% | |
| Price / MA20: | -0.03% | |
| Price / MA50: | +1.32% | |
| Price / MA100: | +2.08% | |
| Price / MAexp7: | -0.10% | |
| Price / MAexp20: | -0.15% | |
| Price / MAexp50: | -0.11% | |
| Price / MAexp100: | -0.06% |
News
Don't forget to follow the news on EUR/NZD. At the time of publication of this analysis, the latest news was as follows:
-
 EUR/NZD Forecast November 18, 2024
-
EUR/NZD Forecast September 13, 2024
-
EUR/NZD Forecast September 4, 2024
-
EUR/NZD Forecast August 19, 2024
-
EUR/NZD Forecast June 7, 2024
About author

Online


Add a comment
Comments
0 comments on the analysis EUR/NZD - 1H