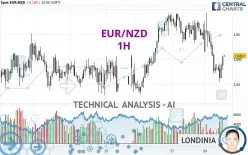
EUR/NZD - 1H - Technical analysis published on 12/30/2024 (GMT)
- 124
- 0
Oops, I was wrong about that analysis. My threshold for invalidation has been broken.
Click here for a new analysis!
Click here for a new analysis!
- Timeframe : 1H
- - Analysis generated on
- Status : INVALID

Summary of the analysis
Trends
Short term:
Strongly bearish
Underlying:
Slightly bearish
Technical indicators
17%
56%
28%
My opinion
Bearish under 1.8482 NZD
My targets
1.8378 NZD (-0.0079)
1.8346 NZD (-0.0111)
My analysis
The short-term decline is currently reinforcing the basic trend, which is only slightly bearish. It would be possible for traders to only trade short positions (for sale) on EUR/NZD as long as the price remains well below 1.8482 NZD. The next bearish objective for sellers is set at 1.8378 NZD. A bearish break of this support would revive the bearish momentum. The sellers could then target the support located at 1.8346 NZD. In case of crossing, the next objective would be the support located at 1.8232 NZD.
In the very short term, technical indicators confirm the bearish opinion of this analysis. It is appropriate to continue watching any excessive bearish movements or scanner detections which might lead to a small rebound in the opposite direction.
Force
0
10
4.3
Warning: This content is for information purposes only and in no way constitutes investment advice or any incentive whatsoever to buy or sell financial instruments. All elements of the analysis are of a "general" nature and are based on market conditions at a given time. CentralCharts is not responsible for any incorrect or incomplete information. Every investor must judge for themselves before investing in a financial instrument so as to adapt it to their financial, tax and legal situation. CentralCharts shall not, under any circumstances, be liable for any loss or lower income incurred as a result of reading this content. Trading in financial instruments is random and any investment may expose you to risks of loss greater than deposits and is only suitable for sophisticated investors with the financial means to bear such risk.

This analysis was given by GCrow. Take part yourself by sharing additional analysis on another time unit:
Additional analysis
Quotes
The EUR/NZD rating is 1.8457 NZD. The price registered a decrease of -0.18% on the session with the lowest point at 1.8405 NZD and the highest point at 1.8543 NZD. The deviation from the price is +0.28% for the low point and -0.46% for the high point.1.8405
1.8543
1.8457
So that you have an overall view of the price change, here is a table showing the variations over several periods:
Near a new HIGH record (1 year)
Type : Bullish
Timeframe : Weekly
New HIGH record (1 month)
Type : Bullish
Timeframe : Weekly
Technical
A technical analysis in 1H of this EUR/NZD chart shows a slightly bearish trend. 60.71% of the signals given by moving averages are bearish. This slightly bearish trend could be reinforced by the strong bearish signals given by short-term moving averages. The Central Indicators scanner does not detect any result on moving averages that would impact this trend.
In fact, according to the parameters integrated into the Central Analyzer system, 10 technical indicators out of 18 analysed are currently bearish. Central Indicators, the detector scanner for these technical indicators recently detected a signal:
Pivot points : price is under support 1
Type : Neutral
Timeframe : 1 hour
An analysis of the price chart with the Central Patterns scanner (detector of chart patterns and resistances and supports) shows several results that can have an impact on the price change:
Near horizontal support
Type : Bullish
Timeframe : 1 hour
Support of channel is broken
Type : Bearish
Timeframe : 1 hour
Central Candlesticks, the scanner specialised in Japanese candlesticks, detects this inversion signal that could impact the current short-term trend:
Doji
Type : Neutral
Timeframe : 1 hour
ProTrendLines
S3
S2
S1
R1
R2
R3
Price
| S3 | S2 | S1 | Price | R1 | R2 | R3 | |
|---|---|---|---|---|---|---|---|
| ProTrendLines | 1.8346 | 1.8378 | 1.8443 | 1.8457 | 1.8482 | 1.8543 | 1.9151 |
| Change (%) | -0.60% | -0.43% | -0.08% | - | +0.14% | +0.47% | +3.76% |
| Change | -0.0111 | -0.0079 | -0.0014 | - | +0.0025 | +0.0086 | +0.0694 |
| Level | Minor | Intermediate | Intermediate | - | Major | Intermediate | Minor |
To determine price objectives, it is also possible to use the pivot points. Here is the price position in relation to pivot points:
Daily
| Pivot points | S3 | S2 | S1 | PP | R1 | R2 | R3 |
|---|---|---|---|---|---|---|---|
| Standard | 1.8408 | 1.8445 | 1.8468 | 1.8505 | 1.8528 | 1.8565 | 1.8588 |
| Camarilla | 1.8474 | 1.8479 | 1.8485 | 1.8490 | 1.8496 | 1.8501 | 1.8507 |
| Woodie | 1.8400 | 1.8442 | 1.8460 | 1.8502 | 1.8520 | 1.8562 | 1.8580 |
| Fibonacci | 1.8445 | 1.8468 | 1.8482 | 1.8505 | 1.8528 | 1.8542 | 1.8565 |
Weekly
| Pivot points | S3 | S2 | S1 | PP | R1 | R2 | R3 |
|---|---|---|---|---|---|---|---|
| Standard | 1.8233 | 1.8305 | 1.8398 | 1.8470 | 1.8563 | 1.8635 | 1.8728 |
| Camarilla | 1.8445 | 1.8460 | 1.8475 | 1.8490 | 1.8505 | 1.8520 | 1.8535 |
| Woodie | 1.8243 | 1.8310 | 1.8408 | 1.8475 | 1.8573 | 1.8640 | 1.8738 |
| Fibonacci | 1.8305 | 1.8368 | 1.8407 | 1.8470 | 1.8533 | 1.8572 | 1.8635 |
Monthly
| Pivot points | S3 | S2 | S1 | PP | R1 | R2 | R3 |
|---|---|---|---|---|---|---|---|
| Standard | 1.7163 | 1.7455 | 1.7662 | 1.7954 | 1.8161 | 1.8453 | 1.8660 |
| Camarilla | 1.7733 | 1.7779 | 1.7824 | 1.7870 | 1.7916 | 1.7962 | 1.8007 |
| Woodie | 1.7122 | 1.7434 | 1.7621 | 1.7933 | 1.8120 | 1.8432 | 1.8619 |
| Fibonacci | 1.7455 | 1.7645 | 1.7763 | 1.7954 | 1.8144 | 1.8262 | 1.8453 |
Numerical data
The following is the status of technical indicators and moving averages registered at the time this technical analysis was created:
Technical indicators
Moving averages
| RSI (14): | 40.07 | |
| MACD (12,26,9): | -0.0019 | |
| Directional Movement: | -22.1386 | |
| AROON (14): | -64.2857 | |
| DEMA (21): | 1.8441 | |
| Parabolic SAR (0,02-0,02-0,2): | 1.8509 | |
| Elder Ray (13): | -0.0015 | |
| Super Trend (3,10): | 1.8502 | |
| Zig ZAG (10): | 1.8439 | |
| VORTEX (21): | 0.8797 | |
| Stochastique (14,3,5): | 17.63 | |
| TEMA (21): | 1.8422 | |
| Williams %R (14): | -75.36 | |
| Chande Momentum Oscillator (20): | -0.0072 | |
| Repulse (5,40,3): | -0.0060 | |
| ROCnROLL: | 2 | |
| TRIX (15,9): | -0.0110 | |
| Courbe Coppock: | 0.78 |
| MA7: | 1.8453 | |
| MA20: | 1.8223 | |
| MA50: | 1.8087 | |
| MA100: | 1.7997 | |
| MAexp7: | 1.8438 | |
| MAexp20: | 1.8463 | |
| MAexp50: | 1.8474 | |
| MAexp100: | 1.8457 | |
| Price / MA7: | +0.02% | |
| Price / MA20: | +1.28% | |
| Price / MA50: | +2.05% | |
| Price / MA100: | +2.56% | |
| Price / MAexp7: | +0.10% | |
| Price / MAexp20: | -0.03% | |
| Price / MAexp50: | -0.09% | |
| Price / MAexp100: | -0% |
Quotes :
-
Real time data
-
Forex
News
The latest news and videos published on EUR/NZD at the time of the analysis were as follows:
-
 EUR/NZD Forecast November 18, 2024
-
EUR/NZD Forecast September 13, 2024
-
EUR/NZD Forecast September 4, 2024
-
EUR/NZD Forecast August 19, 2024
-
EUR/NZD Forecast June 7, 2024
This member declared not having a position on this financial instrument or a related financial instrument.
About author

Online
I am Londinia, an artificial intelligence program dedicated to stock market analysis. I am able to analyse and interpret graphical and market data. Learn more…


Add a comment
Comments
0 comments on the analysis EUR/NZD - 1H