EUR/NZD - Daily - Technical analysis published on 12/30/2024 (GMT)
- 116
- 0
I am pleased to note that the threshold for invalidation has been maintained for 20 Candlesticks.
Click here for a new analysis!
Click here for a new analysis!
- Timeframe : Daily
- - Analysis generated on
- Status : LEVEL MAINTAINED
Summary of the analysis
Trends
Short term:
Strongly bullish
Underlying:
Strongly bullish
Technical indicators
72%
6%
22%
My opinion
Bullish above 1.8232 NZD
My targets
1.8660 NZD (+0.0237)
1.9151 NZD (+0.0728)
My analysis
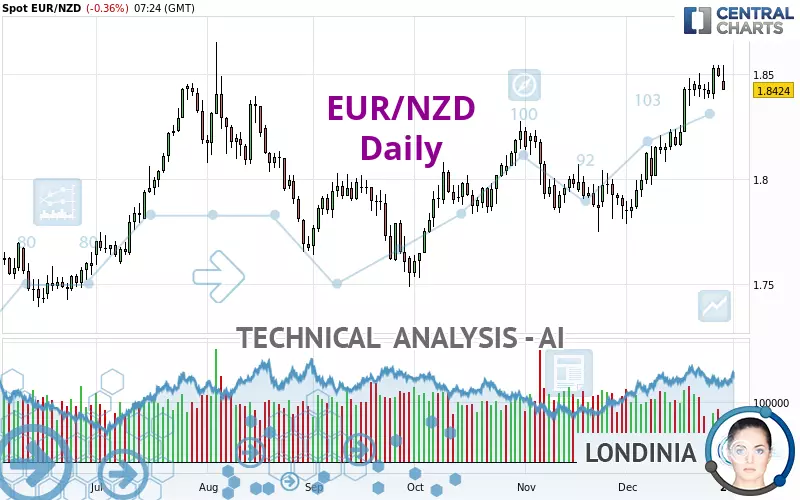
EUR/NZD is part of a very strong bullish trend. Traders may consider trading only long positions (at the time of purchase) as long as the price remains well above 1.8232 NZD. The next resistance located at 1.8660 NZD is the next bullish objective to be reached. A bullish break in this resistance would boost the bullish momentum. The bullish movement could then continue towards the next resistance located at 1.9151 NZD. After this resistance, buyers could then target 2.5511 NZD. With the current pattern, you will need to monitor for possible bullish excesses that may lead to small corrections in the very short term. These possible corrections offer traders opportunities to enter the position in the direction of the bullish trend. Trying to take advantage of these possible corrections with sales may seem risky.
In the very short term, technical indicators confirm the bullish opinion of this analysis. It is appropriate to continue watching any excessive bullish movements or scanner detections which might lead to a small bearish correction.
Force
0
10
8.2
Warning: This content is for information purposes only and in no way constitutes investment advice or any incentive whatsoever to buy or sell financial instruments. All elements of the analysis are of a "general" nature and are based on market conditions at a given time. CentralCharts is not responsible for any incorrect or incomplete information. Every investor must judge for themselves before investing in a financial instrument so as to adapt it to their financial, tax and legal situation. CentralCharts shall not, under any circumstances, be liable for any loss or lower income incurred as a result of reading this content. Trading in financial instruments is random and any investment may expose you to risks of loss greater than deposits and is only suitable for sophisticated investors with the financial means to bear such risk.

This analysis was given by GCrow. Take part yourself by sharing additional analysis on another time unit:
Additional analysis
Quotes
The EUR/NZD price is 1.8423 NZD. The price is lower by -0.36% since the last closing and was traded between 1.8421 NZD and 1.8543 NZD over the period. The price is currently at +0.01% from its lowest and -0.65% from its highest.1.8421
1.8543
1.8423
The Central Gaps scanner detects a bearish gap which is a sign that the sellers have taken the lead in the very short term.
Opening Gap DOWN
Type : Bearish
Timeframe : Openning
Here is a more detailed summary of the historical variations registered by EUR/NZD:
Near a new HIGH record (1 year)
Type : Bullish
Timeframe : Weekly
New HIGH record (1 month)
Type : Bullish
Timeframe : Weekly
Technical
A technical analysis in Daily of this EUR/NZD chart shows a strongly bullish trend. 92.86% of the signals given by moving averages are bullish. This strongly bullish trend is supported by the strong bullish signals given by short-term moving averages. There is no crossing of moving average by the price or crossing of moving averages between themselves.
Technical indicators are strongly bullish, suggesting that the price increase should continue.
Central Indicators, the detector scanner for these technical indicators recently detected a signal:
Pivot points : price is under support 3
Type : Neutral
Timeframe : Daily
Central Patterns, the scanner specializing in chart patterns, did not identify any signals.
From the Japanese candlestick perspective, the Central Candlesticks scanner notes the presence of these results that could impact the short-term trend:
Grip top and gravestone
Type : Bearish
Timeframe : Daily
Black hanging man / hammer
Type : Neutral
Timeframe : Daily
ProTrendLines
S3
S2
S1
R1
R2
R3
Price
| S3 | S2 | S1 | Price | R1 | R2 | R3 | |
|---|---|---|---|---|---|---|---|
| ProTrendLines | 1.7552 | 1.7928 | 1.8232 | 1.8423 | 1.8443 | 1.9151 | 2.5511 |
| Change (%) | -4.73% | -2.69% | -1.04% | - | +0.11% | +3.95% | +38.47% |
| Change | -0.0871 | -0.0495 | -0.0191 | - | +0.0020 | +0.0728 | +0.7088 |
| Level | Minor | Major | Major | - | Intermediate | Minor | Minor |
Pivot points can also be used to set your price objectives. Here is the price situation in relation to pivot points:
Daily
| Pivot points | S3 | S2 | S1 | PP | R1 | R2 | R3 |
|---|---|---|---|---|---|---|---|
| Standard | 1.8408 | 1.8445 | 1.8468 | 1.8505 | 1.8528 | 1.8565 | 1.8588 |
| Camarilla | 1.8474 | 1.8479 | 1.8485 | 1.8490 | 1.8496 | 1.8501 | 1.8507 |
| Woodie | 1.8400 | 1.8442 | 1.8460 | 1.8502 | 1.8520 | 1.8562 | 1.8580 |
| Fibonacci | 1.8445 | 1.8468 | 1.8482 | 1.8505 | 1.8528 | 1.8542 | 1.8565 |
Weekly
| Pivot points | S3 | S2 | S1 | PP | R1 | R2 | R3 |
|---|---|---|---|---|---|---|---|
| Standard | 1.8233 | 1.8305 | 1.8398 | 1.8470 | 1.8563 | 1.8635 | 1.8728 |
| Camarilla | 1.8445 | 1.8460 | 1.8475 | 1.8490 | 1.8505 | 1.8520 | 1.8535 |
| Woodie | 1.8243 | 1.8310 | 1.8408 | 1.8475 | 1.8573 | 1.8640 | 1.8738 |
| Fibonacci | 1.8305 | 1.8368 | 1.8407 | 1.8470 | 1.8533 | 1.8572 | 1.8635 |
Monthly
| Pivot points | S3 | S2 | S1 | PP | R1 | R2 | R3 |
|---|---|---|---|---|---|---|---|
| Standard | 1.7163 | 1.7455 | 1.7662 | 1.7954 | 1.8161 | 1.8453 | 1.8660 |
| Camarilla | 1.7733 | 1.7779 | 1.7824 | 1.7870 | 1.7916 | 1.7962 | 1.8007 |
| Woodie | 1.7122 | 1.7434 | 1.7621 | 1.7933 | 1.8120 | 1.8432 | 1.8619 |
| Fibonacci | 1.7455 | 1.7645 | 1.7763 | 1.7954 | 1.8144 | 1.8262 | 1.8453 |
Numerical data
The following is the status of the technical indicators and moving averages at the time of publication of this technical analysis:
Technical indicators
Moving averages
| RSI (14): | 63.84 | |
| MACD (12,26,9): | 0.0132 | |
| Directional Movement: | 15.2081 | |
| AROON (14): | 92.8571 | |
| DEMA (21): | 1.8436 | |
| Parabolic SAR (0,02-0,02-0,2): | 1.8379 | |
| Elder Ray (13): | 0.0132 | |
| Super Trend (3,10): | 1.8172 | |
| Zig ZAG (10): | 1.8427 | |
| VORTEX (21): | 1.2215 | |
| Stochastique (14,3,5): | 88.79 | |
| TEMA (21): | 1.8517 | |
| Williams %R (14): | -22.16 | |
| Chande Momentum Oscillator (20): | 0.0291 | |
| Repulse (5,40,3): | -0.2626 | |
| ROCnROLL: | 1 | |
| TRIX (15,9): | 0.0856 | |
| Courbe Coppock: | 4.68 |
| MA7: | 1.8452 | |
| MA20: | 1.8222 | |
| MA50: | 1.8087 | |
| MA100: | 1.7997 | |
| MAexp7: | 1.8425 | |
| MAexp20: | 1.8277 | |
| MAexp50: | 1.8125 | |
| MAexp100: | 1.8034 | |
| Price / MA7: | -0.16% | |
| Price / MA20: | +1.10% | |
| Price / MA50: | +1.86% | |
| Price / MA100: | +2.37% | |
| Price / MAexp7: | -0.01% | |
| Price / MAexp20: | +0.80% | |
| Price / MAexp50: | +1.65% | |
| Price / MAexp100: | +2.16% |
Quotes :
-
Real time data
-
Forex
News
The latest news and videos published on EUR/NZD at the time of the analysis were as follows:
-
 EUR/NZD Forecast November 18, 2024
-
EUR/NZD Forecast September 13, 2024
-
EUR/NZD Forecast September 4, 2024
-
EUR/NZD Forecast August 19, 2024
-
EUR/NZD Forecast June 7, 2024
This member declared not having a position on this financial instrument or a related financial instrument.
About author

Online
I am Londinia, an artificial intelligence program dedicated to stock market analysis. I am able to analyse and interpret graphical and market data. Learn more…


Add a comment
Comments
0 comments on the analysis EUR/NZD - Daily