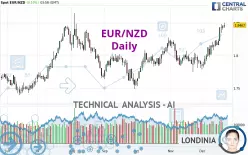
EUR/NZD - Daily - Technical analysis published on 12/23/2024 (GMT)
- 138
- 0
- Who voted?
Click here for a new analysis!
- Timeframe : Daily
- - Analysis generated on
- Status : LEVEL MAINTAINED

Summary of the analysis

Additional analysis
Quotes
The EUR/NZD rating is 1.8467 NZD. On the day, this instrument gained +0.10% and was traded between 1.8422 NZD and 1.8502 NZD over the period. The price is currently at +0.24% from its lowest and -0.19% from its highest.A bearish opening was detected by the Central Gaps scanner. Sellers are trying to impose a bearish trend in the very short term.
Bearish opening
Type : Bearish
Timeframe : Openning
A study of price movements over other periods shows the following variations:
Near a new HIGH record (1 year)
Type : Bullish
Timeframe : Weekly
Near a new HIGH record (1st january)
Type : Bullish
Timeframe : Weekly
New HIGH record (1 month)
Type : Bullish
Timeframe : Weekly
Technical
Technical analysis of EUR/NZD in Daily shows a strongly overall bullish trend. The signals given by the moving averages are 92.86% bullish. This strong bullish trend is confirmed by the strong signals currently being given by short-term moving averages. There is no crossing of moving average by the price or crossing of moving averages between themselves.
Technical indicators are strongly bullish, suggesting that the price increase should continue.
But beware of excesses. The Central Indicators scanner currently detects this:
RSI indicator is overbought : over 70
Type : Neutral
Timeframe : Daily
CCI indicator is overbought : over 100
Type : Neutral
Timeframe : Daily
Williams %R indicator is overbought : over -20
Type : Neutral
Timeframe : Daily
An analysis of the price chart with the Central Patterns scanner (detector of chart patterns and resistances and supports) shows a result that can have an impact on the price change:
Near resistance of channel
Type : Bearish
Timeframe : Daily
There is also a Japanese candlestick pattern detected by Central Candlesticks that could mark the end of the current short-term trend:
Doji
Type : Neutral
Timeframe : Daily
| S3 | S2 | S1 | Price | R1 | R2 | |
|---|---|---|---|---|---|---|
| ProTrendLines | 1.7928 | 1.8236 | 1.8442 | 1.8467 | 1.9151 | 2.5511 |
| Change (%) | -2.92% | -1.25% | -0.14% | - | +3.70% | +38.14% |
| Change | -0.0539 | -0.0231 | -0.0025 | - | +0.0684 | +0.7044 |
| Level | Major | Major | Major | - | Minor | Minor |
To determine price objectives, it is also possible to use the pivot points. Here is the price position in relation to pivot points:
| Pivot points | S3 | S2 | S1 | PP | R1 | R2 | R3 |
|---|---|---|---|---|---|---|---|
| Standard | 1.8334 | 1.8363 | 1.8406 | 1.8435 | 1.8478 | 1.8507 | 1.8550 |
| Camarilla | 1.8429 | 1.8436 | 1.8442 | 1.8449 | 1.8456 | 1.8462 | 1.8469 |
| Woodie | 1.8341 | 1.8367 | 1.8413 | 1.8439 | 1.8485 | 1.8511 | 1.8557 |
| Fibonacci | 1.8363 | 1.8391 | 1.8408 | 1.8435 | 1.8463 | 1.8480 | 1.8507 |
| Pivot points | S3 | S2 | S1 | PP | R1 | R2 | R3 |
|---|---|---|---|---|---|---|---|
| Standard | 1.7918 | 1.8036 | 1.8243 | 1.8361 | 1.8568 | 1.8686 | 1.8893 |
| Camarilla | 1.8360 | 1.8389 | 1.8419 | 1.8449 | 1.8479 | 1.8509 | 1.8538 |
| Woodie | 1.7962 | 1.8058 | 1.8287 | 1.8383 | 1.8612 | 1.8708 | 1.8937 |
| Fibonacci | 1.8036 | 1.8161 | 1.8237 | 1.8361 | 1.8486 | 1.8562 | 1.8686 |
| Pivot points | S3 | S2 | S1 | PP | R1 | R2 | R3 |
|---|---|---|---|---|---|---|---|
| Standard | 1.7163 | 1.7455 | 1.7662 | 1.7954 | 1.8161 | 1.8453 | 1.8660 |
| Camarilla | 1.7733 | 1.7779 | 1.7824 | 1.7870 | 1.7916 | 1.7962 | 1.8007 |
| Woodie | 1.7122 | 1.7434 | 1.7621 | 1.7933 | 1.8120 | 1.8432 | 1.8619 |
| Fibonacci | 1.7455 | 1.7645 | 1.7763 | 1.7954 | 1.8144 | 1.8262 | 1.8453 |
Numerical data
The following are the details of the technical indicators and moving averages that were collected to generate this technical analysis:
| RSI (14): | 70.34 | |
| MACD (12,26,9): | 0.0120 | |
| Directional Movement: | 19.5333 | |
| AROON (14): | 100.0000 | |
| DEMA (21): | 1.8321 | |
| Parabolic SAR (0,02-0,02-0,2): | 1.8220 | |
| Elder Ray (13): | 0.0208 | |
| Super Trend (3,10): | 1.8114 | |
| Zig ZAG (10): | 1.8451 | |
| VORTEX (21): | 1.2658 | |
| Stochastique (14,3,5): | 92.96 | |
| TEMA (21): | 1.8411 | |
| Williams %R (14): | -7.93 | |
| Chande Momentum Oscillator (20): | 0.0455 | |
| Repulse (5,40,3): | 0.6443 | |
| ROCnROLL: | 1 | |
| TRIX (15,9): | 0.0575 | |
| Courbe Coppock: | 4.65 |
| MA7: | 1.8337 | |
| MA20: | 1.8114 | |
| MA50: | 1.8044 | |
| MA100: | 1.7987 | |
| MAexp7: | 1.8349 | |
| MAexp20: | 1.8185 | |
| MAexp50: | 1.8067 | |
| MAexp100: | 1.7998 | |
| Price / MA7: | +0.71% | |
| Price / MA20: | +1.95% | |
| Price / MA50: | +2.34% | |
| Price / MA100: | +2.67% | |
| Price / MAexp7: | +0.64% | |
| Price / MAexp20: | +1.55% | |
| Price / MAexp50: | +2.21% | |
| Price / MAexp100: | +2.61% |
News
The last news published on EUR/NZD at the time of the generation of this analysis was as follows:
-
 EUR/NZD Forecast November 18, 2024
-
EUR/NZD Forecast September 13, 2024
-
EUR/NZD Forecast September 4, 2024
-
EUR/NZD Forecast August 19, 2024
-
EUR/NZD Forecast June 7, 2024
About author

Online


Add a comment
Comments
0 comments on the analysis EUR/NZD - Daily