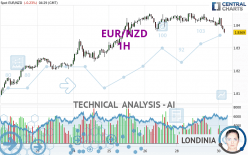
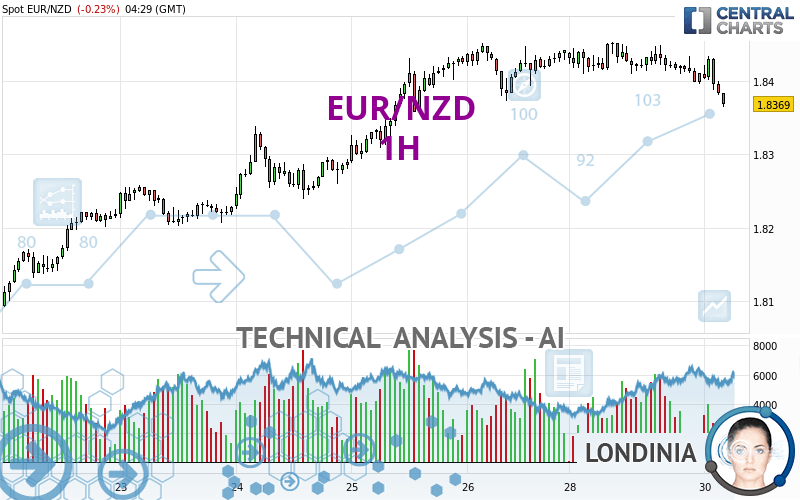
EUR/NZD - 1H - Technical analysis published on 07/30/2024 (GMT)
- 117
- 0
Click here for a new analysis!
- Timeframe : 1H
- - Analysis generated on
- Status : TARGET REACHED
Summary of the analysis

Additional analysis
Quotes
EUR/NZD rating 1.8369 NZD. On the day, this instrument lost -0.23% with the lowest point at 1.8365 NZD and the highest point at 1.8434 NZD. The deviation from the price is +0.02% for the low point and -0.35% for the high point.A bearish opening was detected by the Central Gaps scanner. Sellers are trying to impose a bearish trend in the very short term.
Bearish opening
Type : Bearish
Timeframe : Openning
A study of price movements over other periods shows the following variations:
Near a new HIGH record (1 year)
Type : Bullish
Timeframe : Weekly
Near a new HIGH record (1st january)
Type : Bullish
Timeframe : Weekly
Near a new LOW record (1 month)
Type : Bearish
Timeframe : Weekly
Technical
Technical analysis of EUR/NZD in 1H shows a neutral overall trend. The strong bearish signals currently being given by short-term moving averages could allow the overall trend to return to a bearish trend. The Central Indicators market scanner is currently detecting a bearish signal that could impact this trend:
Bearish price crossover with Moving Average 100
Type : Bearish
Timeframe : 1 hour
An assessment of technical indicators shows a strong bearish signal.
Caution: the Central Indicators scanner currently detects an excess:
CCI indicator is oversold : under -100
Type : Neutral
Timeframe : 1 hour
Previous candle closed under Bollinger bands
Type : Neutral
Timeframe : 1 hour
Williams %R indicator is oversold : under -80
Type : Neutral
Timeframe : 1 hour
Pivot points : price is under support 1
Type : Neutral
Timeframe : 1 hour
Ichimoku : price is under the cloud
Type : Bearish
Timeframe : 1 hour
SuperTrend indicator bearish reversal
Type : Bearish
Timeframe : 1 hour
An analysis of the price chart with the Central Patterns scanner (detector of chart patterns and resistances and supports) shows several results that can have an impact on the price change:
Near horizontal support
Type : Bullish
Timeframe : 1 hour
Support of channel is broken
Type : Bearish
Timeframe : 1 hour
No result was found by the Central Candlesticks scanner on Japanese candlesticks.
| S3 | S2 | S1 | Price | R1 | R2 | R3 | |
|---|---|---|---|---|---|---|---|
| ProTrendLines | 1.8147 | 1.8204 | 1.8339 | 1.8369 | 1.8381 | 1.8451 | 1.9151 |
| Change (%) | -1.21% | -0.90% | -0.16% | - | +0.07% | +0.45% | +4.26% |
| Change | -0.0222 | -0.0165 | -0.0030 | - | +0.0012 | +0.0082 | +0.0782 |
| Level | Intermediate | Minor | Intermediate | - | Intermediate | Intermediate | Minor |
Attention could also be paid to pivot points to set price objectives:
| Pivot points | S3 | S2 | S1 | PP | R1 | R2 | R3 |
|---|---|---|---|---|---|---|---|
| Standard | 1.8330 | 1.8363 | 1.8387 | 1.8420 | 1.8444 | 1.8477 | 1.8501 |
| Camarilla | 1.8395 | 1.8401 | 1.8406 | 1.8411 | 1.8416 | 1.8422 | 1.8427 |
| Woodie | 1.8326 | 1.8361 | 1.8383 | 1.8418 | 1.8440 | 1.8475 | 1.8497 |
| Fibonacci | 1.8363 | 1.8385 | 1.8398 | 1.8420 | 1.8442 | 1.8455 | 1.8477 |
| Pivot points | S3 | S2 | S1 | PP | R1 | R2 | R3 |
|---|---|---|---|---|---|---|---|
| Standard | 1.7828 | 1.7955 | 1.8198 | 1.8325 | 1.8568 | 1.8695 | 1.8938 |
| Camarilla | 1.8340 | 1.8374 | 1.8408 | 1.8442 | 1.8476 | 1.8510 | 1.8544 |
| Woodie | 1.7887 | 1.7984 | 1.8257 | 1.8354 | 1.8627 | 1.8724 | 1.8997 |
| Fibonacci | 1.7955 | 1.8096 | 1.8183 | 1.8325 | 1.8466 | 1.8553 | 1.8695 |
| Pivot points | S3 | S2 | S1 | PP | R1 | R2 | R3 |
|---|---|---|---|---|---|---|---|
| Standard | 1.7109 | 1.7251 | 1.7419 | 1.7561 | 1.7729 | 1.7871 | 1.8039 |
| Camarilla | 1.7503 | 1.7531 | 1.7560 | 1.7588 | 1.7616 | 1.7645 | 1.7673 |
| Woodie | 1.7123 | 1.7258 | 1.7433 | 1.7568 | 1.7743 | 1.7878 | 1.8053 |
| Fibonacci | 1.7251 | 1.7369 | 1.7442 | 1.7561 | 1.7679 | 1.7752 | 1.7871 |
Numerical data
The following is the status of the technical indicators and moving averages at the time of publication of this technical analysis:
| RSI (14): | 37.57 | |
| MACD (12,26,9): | -0.0008 | |
| Directional Movement: | -5.3232 | |
| AROON (14): | -92.8571 | |
| DEMA (21): | 1.8402 | |
| Parabolic SAR (0,02-0,02-0,2): | 1.8431 | |
| Elder Ray (13): | -0.0027 | |
| Super Trend (3,10): | 1.8440 | |
| Zig ZAG (10): | 1.8376 | |
| VORTEX (21): | 0.8586 | |
| Stochastique (14,3,5): | 6.23 | |
| TEMA (21): | 1.8390 | |
| Williams %R (14): | -98.68 | |
| Chande Momentum Oscillator (20): | -0.0048 | |
| Repulse (5,40,3): | -0.2080 | |
| ROCnROLL: | 2 | |
| TRIX (15,9): | -0.0035 | |
| Courbe Coppock: | 0.32 |
| MA7: | 1.8341 | |
| MA20: | 1.8011 | |
| MA50: | 1.7757 | |
| MA100: | 1.7856 | |
| MAexp7: | 1.8396 | |
| MAexp20: | 1.8411 | |
| MAexp50: | 1.8408 | |
| MAexp100: | 1.8366 | |
| Price / MA7: | +0.15% | |
| Price / MA20: | +1.99% | |
| Price / MA50: | +3.45% | |
| Price / MA100: | +2.87% | |
| Price / MAexp7: | -0.15% | |
| Price / MAexp20: | -0.23% | |
| Price / MAexp50: | -0.21% | |
| Price / MAexp100: | +0.02% |
News
The last news published on EUR/NZD at the time of the generation of this analysis was as follows:
-
 EUR/NZD Forecast June 7, 2024
-
EUR/NZD Forecast May 23, 2024
-
EUR/NZD Forecast March 22, 2024
-
iFOREX Market Headlines 14-03-2017: USD, EUR/NZD and Alibaba.
-
EUR/NZD Focus
About author

Online


Add a comment
Comments
0 comments on the analysis EUR/NZD - 1H