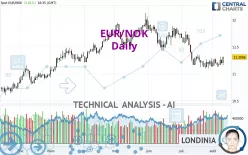
EUR/NOK - Daily - Technical analysis published on 08/10/2023 (GMT)
- 281
- 0
- Timeframe : Daily
- - Analysis generated on
- Status : NEUTRAL

Summary of the analysis

Additional analysis
Quotes
The EUR/NOK rating is 11.3094 NOK. On the day, this instrument gained +1.01% with the lowest point at 11.1570 NOK and the highest point at 11.3174 NOK. The deviation from the price is +1.37% for the low point and -0.07% for the high point.A bullish opening was detected by the Central Gaps scanner. Buyers are trying to impose a bullish momentum in the very short term.
Bullish opening
Type : Bullish
Timeframe : Openning
So that you have an overall view of the price change, here is a table showing the variations over several periods:
Near a new HIGH record (1 month)
Type : Bullish
Timeframe : Weekly
Technical
Technical analysis of this Daily chart of EUR/NOK indicates that the overall trend is slightly bearish. 57.14% of the signals given by moving averages are bearish. As the signals currently given by short-term moving averages are rather neutral, the slightly bearish trend could return to neutral. An assessment of moving averages reveals several bullish signals that could impact this trend:
Bullish price crossover with Moving Average 20
Type : Bullish
Timeframe : Daily
Bullish price crossover with adaptative moving average 20
Type : Bullish
Timeframe : Daily
An assessment of technical indicators shows a moderate bullish signal.
But beware of excesses. The Central Indicators scanner currently detects this:
Williams %R indicator is overbought : over -20
Type : Neutral
Timeframe : Daily
Pivot points : price is over resistance 1
Type : Neutral
Timeframe : Weekly
Pivot points : price is over resistance 2
Type : Neutral
Timeframe : Daily
RSI indicator is back over 50
Type : Bullish
Timeframe : Daily
An analysis of the price chart with the Central Patterns scanner (detector of chart patterns and resistances and supports) shows several results that can have an impact on the price change:
Near resistance of channel
Type : Bearish
Timeframe : Daily
Near support of triangle
Type : Bullish
Timeframe : Daily
No result was found by the Central Candlesticks scanner on Japanese candlesticks.
| S3 | S2 | S1 | Price | R1 | R2 | R3 | |
|---|---|---|---|---|---|---|---|
| ProTrendLines | 10.6483 | 10.8273 | 11.1458 | 11.3094 | 11.5023 | 11.8275 | 12.0020 |
| Change (%) | -5.85% | -4.26% | -1.45% | - | +1.71% | +4.58% | +6.12% |
| Change | -0.6611 | -0.4821 | -0.1636 | - | +0.1929 | +0.5181 | +0.6926 |
| Level | Major | Minor | Major | - | Intermediate | Intermediate | Major |
Pivot points can also be used to set your price objectives. Here is the price situation in relation to pivot points:
| Pivot points | S3 | S2 | S1 | PP | R1 | R2 | R3 |
|---|---|---|---|---|---|---|---|
| Standard | 11.0828 | 11.1332 | 11.1648 | 11.2152 | 11.2468 | 11.2972 | 11.3288 |
| Camarilla | 11.1740 | 11.1815 | 11.1890 | 11.1965 | 11.2040 | 11.2115 | 11.2191 |
| Woodie | 11.0735 | 11.1285 | 11.1555 | 11.2105 | 11.2375 | 11.2925 | 11.3195 |
| Fibonacci | 11.1332 | 11.1645 | 11.1838 | 11.2152 | 11.2465 | 11.2658 | 11.2972 |
| Pivot points | S3 | S2 | S1 | PP | R1 | R2 | R3 |
|---|---|---|---|---|---|---|---|
| Standard | 10.9340 | 11.0297 | 11.0959 | 11.1916 | 11.2578 | 11.3535 | 11.4197 |
| Camarilla | 11.1177 | 11.1325 | 11.1474 | 11.1622 | 11.1770 | 11.1919 | 11.2067 |
| Woodie | 10.9194 | 11.0223 | 11.0813 | 11.1842 | 11.2432 | 11.3461 | 11.4051 |
| Fibonacci | 11.0297 | 11.0915 | 11.1297 | 11.1916 | 11.2534 | 11.2916 | 11.3535 |
| Pivot points | S3 | S2 | S1 | PP | R1 | R2 | R3 |
|---|---|---|---|---|---|---|---|
| Standard | 10.2056 | 10.6506 | 10.8956 | 11.3406 | 11.5856 | 12.0306 | 12.2756 |
| Camarilla | 10.9508 | 11.0140 | 11.0773 | 11.1405 | 11.2038 | 11.2670 | 11.3303 |
| Woodie | 10.1055 | 10.6006 | 10.7955 | 11.2906 | 11.4855 | 11.9806 | 12.1755 |
| Fibonacci | 10.6506 | 10.9142 | 11.0771 | 11.3406 | 11.6042 | 11.7671 | 12.0306 |
Numerical data
The following is the status of the technical indicators and moving averages at the time of publication of this technical analysis:
| RSI (14): | 50.52 | |
| MACD (12,26,9): | -0.0671 | |
| Directional Movement: | 3.9862 | |
| AROON (14): | 85.7143 | |
| DEMA (21): | 11.1585 | |
| Parabolic SAR (0,02-0,02-0,2): | 11.1301 | |
| Elder Ray (13): | 0.0058 | |
| Super Trend (3,10): | 11.5022 | |
| Zig ZAG (10): | 11.3065 | |
| VORTEX (21): | 0.9698 | |
| Stochastique (14,3,5): | 70.65 | |
| TEMA (21): | 11.1744 | |
| Williams %R (14): | -4.29 | |
| Chande Momentum Oscillator (20): | 0.1849 | |
| Repulse (5,40,3): | 1.2890 | |
| ROCnROLL: | -1 | |
| TRIX (15,9): | -0.1260 | |
| Courbe Coppock: | 0.15 |
| MA7: | 11.2214 | |
| MA20: | 11.2170 | |
| MA50: | 11.4715 | |
| MA100: | 11.5376 | |
| MAexp7: | 11.2290 | |
| MAexp20: | 11.2633 | |
| MAexp50: | 11.3923 | |
| MAexp100: | 11.3855 | |
| Price / MA7: | +0.78% | |
| Price / MA20: | +0.82% | |
| Price / MA50: | -1.41% | |
| Price / MA100: | -1.98% | |
| Price / MAexp7: | +0.72% | |
| Price / MAexp20: | +0.41% | |
| Price / MAexp50: | -0.73% | |
| Price / MAexp100: | -0.67% |
About author
Online


Add a comment
Comments
0 comments on the analysis EUR/NOK - Daily