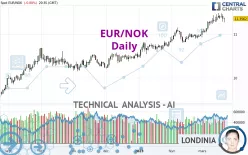
EUR/NOK - Daily - Technical analysis published on 03/22/2023 (GMT)
- 174
- 0
Click here for a new analysis!
- Timeframe : Daily
- - Analysis generated on
- Status : LEVEL MAINTAINED

Summary of the analysis

Additional analysis
Quotes
The EUR/NOK price is 11.3562 NOK. The price registered an increase of +0.00% on the session and was traded between 11.2710 NOK and 11.3785 NOK over the period. The price is currently at +0.76% from its lowest and -0.20% from its highest.The Central Gaps scanner detects a bullish opening. A small advantage for buyers in the very short term.
Bullish opening
Type : Bullish
Timeframe : Openning
Here is a more detailed summary of the historical variations registered by EUR/NOK:
Near a new HIGH record (1 year)
Type : Bullish
Timeframe : Weekly
Near a new HIGH record (1st january)
Type : Bullish
Timeframe : Weekly
Near a new LOW record (1 month)
Type : Bearish
Timeframe : Weekly
Technical
A technical analysis in Daily of this EUR/NOK chart shows a strongly bullish trend. 92.86% of the signals given by moving averages are bullish. The overall trend is supported by the strong bullish signals from short-term moving averages. The Central Indicators scanner does not detect any result on moving averages that would impact this trend.
In fact, 12 technical indicators on 18 studied are currently bullish. Central Indicators, the scanner specialised in technical indicators, has identified these signals:
Parabolic SAR indicator bearish reversal
Type : Bearish
Timeframe : Daily
Price is back under the pivot point
Type : Bearish
Timeframe : Weekly
Central Patterns, the scanner specializing in chart patterns, did not identify any signals.
Central Candlesticks, the scanner specialised in Japanese candlesticks, detects these signals that could have an impact on the current short-term trend:
Bullish harami
Type : Bullish
Timeframe : Daily
Doji
Type : Neutral
Timeframe : Daily
| S3 | S2 | S1 | Price | R1 | R2 | |
|---|---|---|---|---|---|---|
| ProTrendLines | 10.6483 | 10.9970 | 11.1458 | 11.3562 | 11.6614 | 12.5716 |
| Change (%) | -6.23% | -3.16% | -1.85% | - | +2.69% | +10.70% |
| Change | -0.7079 | -0.3592 | -0.2104 | - | +0.3052 | +1.2154 |
| Level | Major | Minor | Intermediate | - | Minor | Major |
Pivot points can also be used to set your price objectives. Here is the price situation in relation to pivot points:
| Pivot points | S3 | S2 | S1 | PP | R1 | R2 | R3 |
|---|---|---|---|---|---|---|---|
| Standard | 11.1080 | 11.1970 | 11.2766 | 11.3656 | 11.4452 | 11.5342 | 11.6138 |
| Camarilla | 11.3099 | 11.3254 | 11.3409 | 11.3563 | 11.3718 | 11.3872 | 11.4027 |
| Woodie | 11.1034 | 11.1947 | 11.2720 | 11.3633 | 11.4406 | 11.5319 | 11.6092 |
| Fibonacci | 11.1970 | 11.2614 | 11.3012 | 11.3656 | 11.4300 | 11.4698 | 11.5342 |
| Pivot points | S3 | S2 | S1 | PP | R1 | R2 | R3 |
|---|---|---|---|---|---|---|---|
| Standard | 11.0516 | 11.1558 | 11.2746 | 11.3788 | 11.4976 | 11.6018 | 11.7206 |
| Camarilla | 11.3321 | 11.3525 | 11.3730 | 11.3934 | 11.4138 | 11.4343 | 11.4547 |
| Woodie | 11.0589 | 11.1595 | 11.2819 | 11.3825 | 11.5049 | 11.6055 | 11.7279 |
| Fibonacci | 11.1558 | 11.2410 | 11.2936 | 11.3788 | 11.4640 | 11.5166 | 11.6018 |
| Pivot points | S3 | S2 | S1 | PP | R1 | R2 | R3 |
|---|---|---|---|---|---|---|---|
| Standard | 10.4585 | 10.6310 | 10.8085 | 10.9810 | 11.1585 | 11.3310 | 11.5085 |
| Camarilla | 10.8899 | 10.9219 | 10.9540 | 10.9861 | 11.0182 | 11.0503 | 11.0824 |
| Woodie | 10.4611 | 10.6323 | 10.8111 | 10.9823 | 11.1611 | 11.3323 | 11.5111 |
| Fibonacci | 10.6310 | 10.7647 | 10.8473 | 10.9810 | 11.1147 | 11.1973 | 11.3310 |
Numerical data
The following are the details of the technical indicators and moving averages that were collected to generate this technical analysis:
| RSI (14): | 68.36 | |
| MACD (12,26,9): | 0.1235 | |
| Directional Movement: | 12.8797 | |
| AROON (14): | 64.2857 | |
| DEMA (21): | 11.4034 | |
| Parabolic SAR (0,02-0,02-0,2): | 11.4830 | |
| Elder Ray (13): | 0.0193 | |
| Super Trend (3,10): | 11.0939 | |
| Zig ZAG (10): | 11.3601 | |
| VORTEX (21): | 1.1508 | |
| Stochastique (14,3,5): | 76.99 | |
| TEMA (21): | 11.4328 | |
| Williams %R (14): | -28.14 | |
| Chande Momentum Oscillator (20): | 0.2284 | |
| Repulse (5,40,3): | 0.0676 | |
| ROCnROLL: | 1 | |
| TRIX (15,9): | 0.1568 | |
| Courbe Coppock: | 5.94 |
| MA7: | 11.3771 | |
| MA20: | 11.2132 | |
| MA50: | 10.9997 | |
| MA100: | 10.7251 | |
| MAexp7: | 11.3583 | |
| MAexp20: | 11.2410 | |
| MAexp50: | 11.0314 | |
| MAexp100: | 10.8062 | |
| Price / MA7: | -0.18% | |
| Price / MA20: | +1.28% | |
| Price / MA50: | +3.24% | |
| Price / MA100: | +5.88% | |
| Price / MAexp7: | -0.02% | |
| Price / MAexp20: | +1.02% | |
| Price / MAexp50: | +2.94% | |
| Price / MAexp100: | +5.09% |
About author
Online


Add a comment
Comments
0 comments on the analysis EUR/NOK - Daily