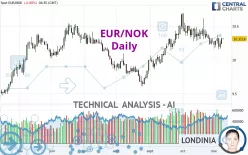
EUR/NOK - Daily - Technical analysis published on 11/09/2022 (GMT)
- 188
- 0
Click here for a new analysis!
- Timeframe : Daily
- - Analysis generated on
- Status : TARGET REACHED

Summary of the analysis

Additional analysis
Quotes
EUR/NOK rating 10.3116 NOK. The price registered an increase of +0.00% on the session and was between 10.3021 NOK and 10.3198 NOK. This implies that the price is at +0.09% from its lowest and at -0.08% from its highest.Here is a more detailed summary of the historical variations registered by EUR/NOK:
Near a new HIGH record (1 year)
Type : Bullish
Timeframe : Weekly
Near a new HIGH record (1st january)
Type : Bullish
Timeframe : Weekly
Near a new HIGH record (1 month)
Type : Bullish
Timeframe : Weekly
Technical
A technical analysis in Daily of this EUR/NOK chart shows a bullish trend. The signals given by moving averages are 71.43% bullish. This bullish trend is slowing down slightly given the slightly bullish signals of short-term moving averages. The Central Indicators scanner detects bullish signals on moving averages that could impact this trend:
Bullish trend reversal : adaptative moving average 20
Type : Bullish
Timeframe : Daily
Bullish trend reversal : adaptative moving average 50
Type : Bullish
Timeframe : Daily
An assessment of technical indicators does not currently provide any relevant information to suggest whether the signal given by the technical indicators is more bullish or bearish.
Central Indicators, the detector scanner for these technical indicators recently detected a signal:
Price is back over the pivot point
Type : Bullish
Timeframe : Weekly
Central Patterns, the market scanner focusing on chart patterns, resistances and supports found this result:
Near resistance of channel
Type : Bearish
Timeframe : Daily
There is also a Japanese candlestick pattern detected by Central Candlesticks that could mark the end of the current short-term trend:
Doji
Type : Neutral
Timeframe : Daily
| S3 | S2 | S1 | Price | R1 | R2 | R3 | |
|---|---|---|---|---|---|---|---|
| ProTrendLines | 9.8924 | 9.9924 | 10.2435 | 10.3116 | 10.3951 | 10.5049 | 10.6694 |
| Change (%) | -4.07% | -3.10% | -0.66% | - | +0.81% | +1.87% | +3.47% |
| Change | -0.4192 | -0.3192 | -0.0681 | - | +0.0835 | +0.1933 | +0.3578 |
| Level | Minor | Major | Intermediate | - | Major | Intermediate | Intermediate |
Pivot points can also be used to set your price objectives. Here is the price situation in relation to pivot points:
| Pivot points | S3 | S2 | S1 | PP | R1 | R2 | R3 |
|---|---|---|---|---|---|---|---|
| Standard | 10.1621 | 10.1989 | 10.2554 | 10.2922 | 10.3487 | 10.3855 | 10.4420 |
| Camarilla | 10.2863 | 10.2949 | 10.3035 | 10.3120 | 10.3206 | 10.3291 | 10.3377 |
| Woodie | 10.1721 | 10.2038 | 10.2654 | 10.2971 | 10.3587 | 10.3904 | 10.4520 |
| Fibonacci | 10.1989 | 10.2345 | 10.2565 | 10.2922 | 10.3278 | 10.3498 | 10.3855 |
| Pivot points | S3 | S2 | S1 | PP | R1 | R2 | R3 |
|---|---|---|---|---|---|---|---|
| Standard | 9.8948 | 10.0247 | 10.1122 | 10.2421 | 10.3296 | 10.4595 | 10.5470 |
| Camarilla | 10.1398 | 10.1597 | 10.1797 | 10.1996 | 10.2195 | 10.2395 | 10.2594 |
| Woodie | 9.8735 | 10.0141 | 10.0909 | 10.2315 | 10.3083 | 10.4489 | 10.5257 |
| Fibonacci | 10.0247 | 10.1078 | 10.1591 | 10.2421 | 10.3252 | 10.3765 | 10.4595 |
| Pivot points | S3 | S2 | S1 | PP | R1 | R2 | R3 |
|---|---|---|---|---|---|---|---|
| Standard | 9.6221 | 9.9210 | 10.0959 | 10.3948 | 10.5697 | 10.8686 | 11.0435 |
| Camarilla | 10.1406 | 10.1840 | 10.2275 | 10.2709 | 10.3143 | 10.3578 | 10.4012 |
| Woodie | 9.5602 | 9.8900 | 10.0340 | 10.3638 | 10.5078 | 10.8376 | 10.9816 |
| Fibonacci | 9.9210 | 10.1020 | 10.2138 | 10.3948 | 10.5758 | 10.6876 | 10.8686 |
Numerical data
The following are the details of the technical indicators and moving averages that were collected to generate this technical analysis:
| RSI (14): | 50.74 | |
| MACD (12,26,9): | -0.0095 | |
| Directional Movement: | 1.4530 | |
| AROON (14): | -71.4285 | |
| DEMA (21): | 10.3033 | |
| Parabolic SAR (0,02-0,02-0,2): | 10.4213 | |
| Elder Ray (13): | 0.0148 | |
| Super Trend (3,10): | 10.1686 | |
| Zig ZAG (10): | 10.3122 | |
| VORTEX (21): | 0.9857 | |
| Stochastique (14,3,5): | 29.06 | |
| TEMA (21): | 10.2527 | |
| Williams %R (14): | -65.90 | |
| Chande Momentum Oscillator (20): | -0.0682 | |
| Repulse (5,40,3): | 0.5531 | |
| ROCnROLL: | 1 | |
| TRIX (15,9): | -0.0006 | |
| Courbe Coppock: | 2.21 |
| MA7: | 10.2698 | |
| MA20: | 10.3208 | |
| MA50: | 10.2758 | |
| MA100: | 10.1610 | |
| MAexp7: | 10.2846 | |
| MAexp20: | 10.3054 | |
| MAexp50: | 10.2624 | |
| MAexp100: | 10.1938 | |
| Price / MA7: | +0.41% | |
| Price / MA20: | -0.09% | |
| Price / MA50: | +0.35% | |
| Price / MA100: | +1.48% | |
| Price / MAexp7: | +0.26% | |
| Price / MAexp20: | +0.06% | |
| Price / MAexp50: | +0.48% | |
| Price / MAexp100: | +1.16% |
About author
Online


Add a comment
Comments
0 comments on the analysis EUR/NOK - Daily