| Open: | - |
| Change: | - |
| Volume: | - |
| Low: | - |
| High: | - |
| High / Low range: | - |
| Type: | Forex |
| Ticker: | EURJPY |
| ISIN: |
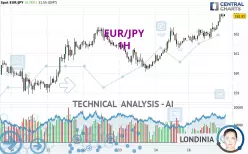
EUR/JPY - 1H - Technical analysis published on 03/17/2025 (GMT)
- 119
- 0
- 03/17/2025 - 21:55
Click here for a new analysis!
- Timeframe : 1H
- - Analysis generated on 03/17/2025 - 21:55
- Status : TARGET REACHED

Summary of the analysis

Additional analysis
Quotes
The EUR/JPY rating is 162.91 JPY. On the day, this instrument gained +0.78% and was between 161.55 JPY and 163.06 JPY. This implies that the price is at +0.84% from its lowest and at -0.09% from its highest.The Central Gaps scanner detects a bullish opening marking the presence of buyers ahead of sellers at the opening but not sufficiently marked to allow the price to register a quotation gap.
Bullish opening
Type : Bullish
Timeframe : Openning
A study of price movements over other periods shows the following variations:
Near a new LOW record (1 year)
Type : Bearish
Timeframe : Weekly
Near a new LOW record (1st january)
Type : Bearish
Timeframe : Weekly
New HIGH record (1 month)
Type : Bullish
Timeframe : Weekly
Technical
Technical analysis of this 1H chart of EUR/JPY indicates that the overall trend is strongly bullish. 92.86% of the signals given by moving averages are bullish. This strongly bullish trend is supported by the strong bullish signals given by short-term moving averages. The Central Indicators market scanner currently does not detect any result that concerns moving averages.
Technical indicators are strongly bullish, suggesting that the price increase should continue.
But beware of excesses. The Central Indicators scanner currently detects this:
CCI indicator is overbought : over 100
Type : Neutral
Timeframe : 1 hour
RSI indicator: bearish divergence
Type : Bearish
Timeframe : 1 hour
Williams %R indicator is overbought : over -20
Type : Neutral
Timeframe : 1 hour
Pivot points : price is over resistance 1 (Daily)
Type : Neutral
Timeframe : 1 hour
Central Patterns, the market scanner focusing on chart patterns, resistances and supports found these results:
Near horizontal resistance
Type : Bearish
Timeframe : 1 hour
Resistance of channel is broken
Type : Bullish
Timeframe : 1 hour
The Central Candlesticks scanner, specialised in Japanese candlesticks, did not identify any signals.
| S3 | S2 | S1 | Price | R1 | R2 | R3 | |
|---|---|---|---|---|---|---|---|
| ProTrendLines | 161.28 | 161.79 | 162.36 | 162.91 | 164.13 | 170.31 | 172.65 |
| Change (%) | -1.00% | -0.69% | -0.34% | - | +0.75% | +4.54% | +5.98% |
| Change | -1.63 | -1.12 | -0.55 | - | +1.22 | +7.40 | +9.74 |
| Level | Intermediate | Minor | Intermediate | - | Major | Minor | Minor |
Attention could also be paid to pivot points to set price objectives:
| Pivot points | S3 | S2 | S1 | PP | R1 | R2 | R3 |
|---|---|---|---|---|---|---|---|
| Standard | 158.83 | 159.66 | 160.66 | 161.49 | 162.49 | 163.32 | 164.32 |
| Camarilla | 161.15 | 161.32 | 161.48 | 161.65 | 161.82 | 161.99 | 162.15 |
| Woodie | 158.91 | 159.70 | 160.74 | 161.53 | 162.57 | 163.36 | 164.40 |
| Fibonacci | 159.66 | 160.36 | 160.79 | 161.49 | 162.19 | 162.62 | 163.32 |
| Pivot points | S3 | S2 | S1 | PP | R1 | R2 | R3 |
|---|---|---|---|---|---|---|---|
| Standard | 156.12 | 157.51 | 159.58 | 160.97 | 163.04 | 164.43 | 166.50 |
| Camarilla | 160.70 | 161.02 | 161.33 | 161.65 | 161.97 | 162.28 | 162.60 |
| Woodie | 156.46 | 157.68 | 159.92 | 161.14 | 163.38 | 164.60 | 166.84 |
| Fibonacci | 157.51 | 158.83 | 159.65 | 160.97 | 162.29 | 163.11 | 164.43 |
| Pivot points | S3 | S2 | S1 | PP | R1 | R2 | R3 |
|---|---|---|---|---|---|---|---|
| Standard | 147.27 | 151.03 | 153.66 | 157.42 | 160.05 | 163.81 | 166.44 |
| Camarilla | 154.52 | 155.11 | 155.69 | 156.28 | 156.87 | 157.45 | 158.04 |
| Woodie | 146.70 | 150.75 | 153.09 | 157.14 | 159.48 | 163.53 | 165.87 |
| Fibonacci | 151.03 | 153.47 | 154.98 | 157.42 | 159.86 | 161.37 | 163.81 |
Numerical data
The following is the status of the technical indicators and moving averages at the time of publication of this technical analysis:
| RSI (14): | 69.88 | |
| MACD (12,26,9): | 0.3300 | |
| Directional Movement: | 19.57 | |
| AROON (14): | 85.72 | |
| DEMA (21): | 162.76 | |
| Parabolic SAR (0,02-0,02-0,2): | 162.35 | |
| Elder Ray (13): | 0.40 | |
| Super Trend (3,10): | 162.10 | |
| Zig ZAG (10): | 162.91 | |
| VORTEX (21): | 1.2200 | |
| Stochastique (14,3,5): | 90.47 | |
| TEMA (21): | 162.89 | |
| Williams %R (14): | -11.94 | |
| Chande Momentum Oscillator (20): | 0.87 | |
| Repulse (5,40,3): | 0.1100 | |
| ROCnROLL: | 1 | |
| TRIX (15,9): | 0.0200 | |
| Courbe Coppock: | 0.94 |
| MA7: | 161.14 | |
| MA20: | 158.79 | |
| MA50: | 159.97 | |
| MA100: | 161.21 | |
| MAexp7: | 162.74 | |
| MAexp20: | 162.36 | |
| MAexp50: | 161.90 | |
| MAexp100: | 161.43 | |
| Price / MA7: | +1.10% | |
| Price / MA20: | +2.59% | |
| Price / MA50: | +1.84% | |
| Price / MA100: | +1.05% | |
| Price / MAexp7: | +0.10% | |
| Price / MAexp20: | +0.34% | |
| Price / MAexp50: | +0.62% | |
| Price / MAexp100: | +0.92% |
News
Don't forget to follow the news on EUR/JPY. At the time of publication of this analysis, the latest news was as follows:
-
03/11/2025 - 18:32
 EUR/JPY Analysis: Can the Euro Break Higher Again?
-
03/06/2025 - 19:15
EUR/JPY Analysis: The Euro is in the Middle of a Range Against the Yen
-
03/05/2025 - 17:29
EUR/JPY Analysis: Can the Euro Continue Higher?
-
03/03/2025 - 16:55
EUR/JPY Analysis: Can the Euro Continue to Climb Against the Yen?
-
01/28/2025 - 18:40
EUR/JPY Price Forecast - Can the Euro Climb Against the Lowly Yen?
About author

Online


Add a comment
Comments
0 comments on the analysis EUR/JPY - 1H