EUR/JPY - Weekly - Technical analysis published on 10/25/2024 (GMT)
- 126
- 0
Click here for a new analysis!
- Timeframe : Weekly
- - Analysis generated on
- Status : INVALID

Summary of the analysis

Additional analysis
Quotes
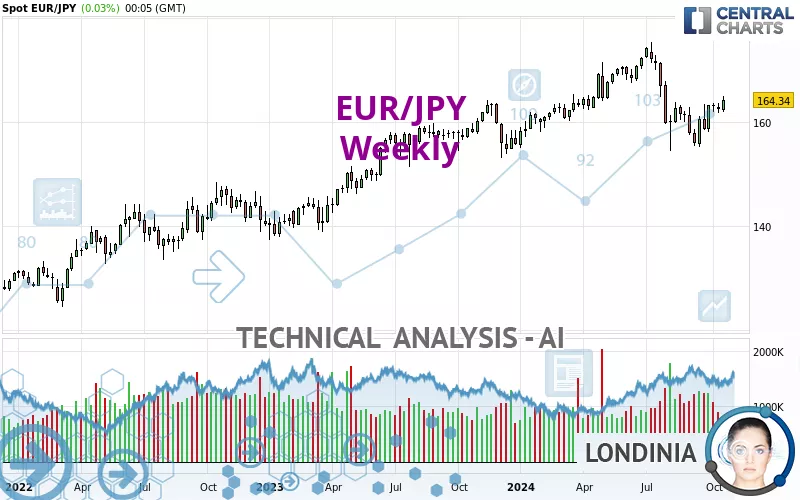
The EUR/JPY price is 164.33 JPY. The price is up +1.10% over 5 days with the lowest point at 162.00 JPY and the highest point at 165.02 JPY. The deviation from the price is +1.44% for the low point and -0.42% for the high point.The Central Gaps scanner detects a bullish opening marking the presence of buyers ahead of sellers at the opening but not sufficiently marked to allow the price to register a quotation gap.
Bullish opening
Type : Bullish
Timeframe : Openning
A study of price movements over other periods shows the following variations:
Near a new LOW record (1 month)
Type : Bearish
Timeframe : Weekly
Technical
Technical analysis of this Weekly chart of EUR/JPY indicates that the overall trend is strongly bullish. The signals given by moving averages are 82.14% bullish. This strongly bullish trend seems to be running out of steam given the signals being given by short-term moving averages. The Central Indicators scanner detects bullish signals on moving averages that could impact this trend:
Bullish price crossover with Moving Average 50
Type : Bullish
Timeframe : Weekly
Bullish price crossover with adaptative moving average 50
Type : Bullish
Timeframe : Weekly
In fact, only 9 technical indicators out of 18 studied are currently positioned bullish. Central Indicators, the detector scanner for these technical indicators has recently detected several signals:
Pivot points : price is over resistance 1
Type : Neutral
Timeframe : Weekly
RSI indicator is back over 50
Type : Bullish
Timeframe : Weekly
Parabolic SAR indicator bullish reversal
Type : Bullish
Timeframe : Weekly
Momentum indicator is back over 0
Type : Bullish
Timeframe : Weekly
Williams %R indicator is back over -50
Type : Bullish
Timeframe : Weekly
The Central Patterns scanner, which studies chart patterns, resistances and supports, has identified this signal:
Near resistance of channel
Type : Bearish
Timeframe : Weekly
The presence of a bullish Japanese candlestick pattern detected by Central Candlesticks that could cause a very short term rebound was also detected:
Bullish engulfing lines
Type : Bullish
Timeframe : Weekly
| S3 | S2 | S1 | Price | R1 | R2 | |
|---|---|---|---|---|---|---|
| ProTrendLines | 149.26 | 154.81 | 164.13 | 164.33 | 169.54 | 175.06 |
| Change (%) | -9.17% | -5.79% | -0.12% | - | +3.17% | +6.53% |
| Change | -15.07 | -9.52 | -0.20 | - | +5.21 | +10.73 |
| Level | Intermediate | Intermediate | Intermediate | - | Major | Major |
To determine price objectives, it is also possible to use the pivot points. Here is the price position in relation to pivot points:
| Pivot points | S3 | S2 | S1 | PP | R1 | R2 | R3 |
|---|---|---|---|---|---|---|---|
| Standard | 162.86 | 163.33 | 163.81 | 164.28 | 164.76 | 165.23 | 165.71 |
| Camarilla | 164.03 | 164.12 | 164.20 | 164.29 | 164.38 | 164.46 | 164.55 |
| Woodie | 162.87 | 163.33 | 163.82 | 164.28 | 164.77 | 165.23 | 165.72 |
| Fibonacci | 163.33 | 163.69 | 163.92 | 164.28 | 164.64 | 164.87 | 165.23 |
| Pivot points | S3 | S2 | S1 | PP | R1 | R2 | R3 |
|---|---|---|---|---|---|---|---|
| Standard | 159.92 | 160.89 | 161.68 | 162.65 | 163.44 | 164.41 | 165.20 |
| Camarilla | 162.00 | 162.16 | 162.32 | 162.48 | 162.64 | 162.80 | 162.96 |
| Woodie | 159.84 | 160.85 | 161.60 | 162.61 | 163.36 | 164.37 | 165.12 |
| Fibonacci | 160.89 | 161.56 | 161.97 | 162.65 | 163.32 | 163.73 | 164.41 |
| Pivot points | S3 | S2 | S1 | PP | R1 | R2 | R3 |
|---|---|---|---|---|---|---|---|
| Standard | 147.30 | 151.22 | 155.64 | 159.56 | 163.98 | 167.90 | 172.32 |
| Camarilla | 157.76 | 158.52 | 159.29 | 160.05 | 160.82 | 161.58 | 162.34 |
| Woodie | 147.54 | 151.35 | 155.88 | 159.69 | 164.22 | 168.03 | 172.56 |
| Fibonacci | 151.22 | 154.41 | 156.38 | 159.56 | 162.75 | 164.72 | 167.90 |
Numerical data
The following is the status of technical indicators and moving averages registered at the time this technical analysis was created:
| RSI (14): | 51.75 | |
| MACD (12,26,9): | -0.8000 | |
| Directional Movement: | -3.39 | |
| AROON (14): | -21.43 | |
| DEMA (21): | 162.32 | |
| Parabolic SAR (0,02-0,02-0,2): | 154.41 | |
| Elder Ray (13): | 0.90 | |
| Super Trend (3,10): | 168.72 | |
| Zig ZAG (10): | 164.24 | |
| VORTEX (21): | 0.9100 | |
| Stochastique (14,3,5): | 47.40 | |
| TEMA (21): | 160.70 | |
| Williams %R (14): | -43.07 | |
| Chande Momentum Oscillator (20): | 4.32 | |
| Repulse (5,40,3): | 1.9900 | |
| ROCnROLL: | 1 | |
| TRIX (15,9): | -0.0700 | |
| Courbe Coppock: | 8.82 |
| MA7: | 163.49 | |
| MA20: | 162.64 | |
| MA50: | 160.93 | |
| MA100: | 164.60 | |
| MAexp7: | 162.32 | |
| MAexp20: | 163.15 | |
| MAexp50: | 162.13 | |
| MAexp100: | 156.94 | |
| Price / MA7: | +0.51% | |
| Price / MA20: | +1.04% | |
| Price / MA50: | +2.11% | |
| Price / MA100: | -0.16% | |
| Price / MAexp7: | +1.24% | |
| Price / MAexp20: | +0.72% | |
| Price / MAexp50: | +1.36% | |
| Price / MAexp100: | +4.71% |
News
The latest news and videos published on EUR/JPY at the time of the analysis were as follows:
-
 EUR/JPY Forecast October 24, 2024
-
EUR/JPY Forecast October 2, 2024
-
EUR/JPY Forecast September 20, 2024
-
EUR/JPY Forecast September 18, 2024
-
EUR/JPY Forecast September 3, 2024
About author

Online


Add a comment
Comments
0 comments on the analysis EUR/JPY - Weekly