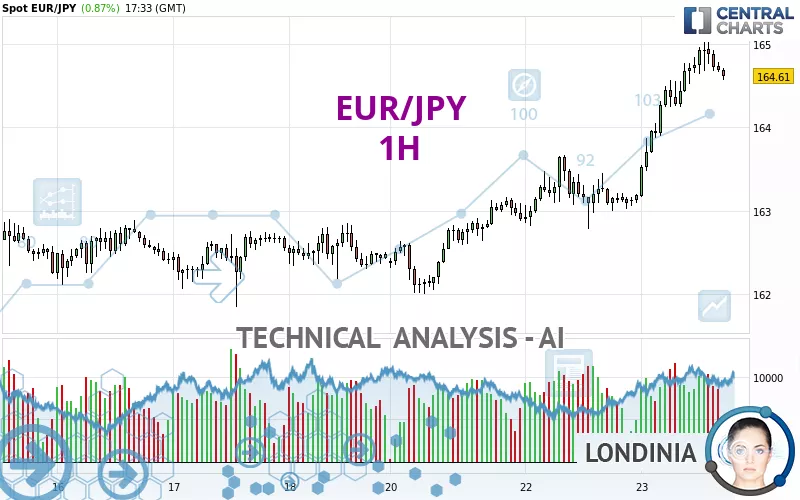
EUR/JPY - 1H - Technical analysis published on 10/23/2024 (GMT)
- 117
- 0
Click here for a new analysis!
- Timeframe : 1H
- - Analysis generated on
- Status : INVALID

Summary of the analysis

Additional analysis
Quotes
The EUR/JPY price is 164.61 JPY. The price has increased by +0.87% since the last closing and was between 163.17 JPY and 165.02 JPY. This implies that the price is at +0.88% from its lowest and at -0.25% from its highest.A bearish opening was detected by the Central Gaps scanner. Sellers are trying to impose a bearish trend in the very short term.
Bearish opening
Type : Bearish
Timeframe : Openning
So that you have an overall view of the price change, here is a table showing the variations over several periods:
New HIGH record (1 month)
Type : Bullish
Timeframe : Weekly
Technical
A technical analysis in 1H of this EUR/JPY chart shows a strongly bullish trend. The signals given by the moving averages are 92.86% bullish. This strong bullish trend is confirmed by the strong signals currently being given by short-term moving averages. The Central Indicators scanner detects a bearish signal on moving averages that could impact this trend:
Bearish price crossover with adaptative moving average 20
Type : Bearish
Timeframe : 1 hour
An assessment of technical indicators shows a moderate bullish signal.
Other results related to technical indicators were also found by the Central Indicators scanner:
Pivot points : price is over resistance 2
Type : Neutral
Timeframe : Weekly
Pivot points : price is over resistance 3
Type : Neutral
Timeframe : 1 hour
MACD crosses DOWN its Moving Average
Type : Bearish
Timeframe : 1 hour
Central Patterns, the market scanner focusing on chart patterns, resistances and supports found these results:
Near horizontal resistance
Type : Bearish
Timeframe : 1 hour
Resistance of channel is broken
Type : Bullish
Timeframe : 1 hour
The presence of these Japanese chandelier patterns detected by Central Candlesticks that could impact the current short-term trend were also noted:
White hanging man / hammer
Type : Neutral
Timeframe : 1 hour
Doji
Type : Neutral
Timeframe : 1 hour
| S3 | S2 | S1 | Price | R1 | R2 | R3 | |
|---|---|---|---|---|---|---|---|
| ProTrendLines | 163.45 | 163.61 | 164.13 | 164.61 | 169.54 | 172.65 | 175.06 |
| Change (%) | -0.70% | -0.61% | -0.29% | - | +2.99% | +4.88% | +6.35% |
| Change | -1.16 | -1.00 | -0.48 | - | +4.93 | +8.04 | +10.45 |
| Level | Intermediate | Intermediate | Intermediate | - | Major | Minor | Major |
To determine price objectives, it is also possible to use the pivot points. Here is the price position in relation to pivot points:
| Pivot points | S3 | S2 | S1 | PP | R1 | R2 | R3 |
|---|---|---|---|---|---|---|---|
| Standard | 161.87 | 162.32 | 162.76 | 163.21 | 163.65 | 164.10 | 164.54 |
| Camarilla | 162.95 | 163.03 | 163.11 | 163.19 | 163.27 | 163.35 | 163.44 |
| Woodie | 161.86 | 162.32 | 162.75 | 163.21 | 163.64 | 164.10 | 164.53 |
| Fibonacci | 162.32 | 162.66 | 162.87 | 163.21 | 163.55 | 163.76 | 164.10 |
| Pivot points | S3 | S2 | S1 | PP | R1 | R2 | R3 |
|---|---|---|---|---|---|---|---|
| Standard | 159.92 | 160.89 | 161.68 | 162.65 | 163.44 | 164.41 | 165.20 |
| Camarilla | 162.00 | 162.16 | 162.32 | 162.48 | 162.64 | 162.80 | 162.96 |
| Woodie | 159.84 | 160.85 | 161.60 | 162.61 | 163.36 | 164.37 | 165.12 |
| Fibonacci | 160.89 | 161.56 | 161.97 | 162.65 | 163.32 | 163.73 | 164.41 |
| Pivot points | S3 | S2 | S1 | PP | R1 | R2 | R3 |
|---|---|---|---|---|---|---|---|
| Standard | 147.30 | 151.22 | 155.64 | 159.56 | 163.98 | 167.90 | 172.32 |
| Camarilla | 157.76 | 158.52 | 159.29 | 160.05 | 160.82 | 161.58 | 162.34 |
| Woodie | 147.54 | 151.35 | 155.88 | 159.69 | 164.22 | 168.03 | 172.56 |
| Fibonacci | 151.22 | 154.41 | 156.38 | 159.56 | 162.75 | 164.72 | 167.90 |
Numerical data
The following are the details of the technical indicators and moving averages that were collected to generate this technical analysis:
| RSI (14): | 69.11 | |
| MACD (12,26,9): | 0.3800 | |
| Directional Movement: | 17.17 | |
| AROON (14): | 71.43 | |
| DEMA (21): | 164.86 | |
| Parabolic SAR (0,02-0,02-0,2): | 165.01 | |
| Elder Ray (13): | 0.10 | |
| Super Trend (3,10): | 164.06 | |
| Zig ZAG (10): | 164.65 | |
| VORTEX (21): | 1.2800 | |
| Stochastique (14,3,5): | 71.61 | |
| TEMA (21): | 164.98 | |
| Williams %R (14): | -32.14 | |
| Chande Momentum Oscillator (20): | 0.22 | |
| Repulse (5,40,3): | -0.0600 | |
| ROCnROLL: | 1 | |
| TRIX (15,9): | 0.0300 | |
| Courbe Coppock: | 1.20 |
| MA7: | 162.92 | |
| MA20: | 162.26 | |
| MA50: | 160.89 | |
| MA100: | 164.70 | |
| MAexp7: | 164.70 | |
| MAexp20: | 164.35 | |
| MAexp50: | 163.77 | |
| MAexp100: | 163.35 | |
| Price / MA7: | +1.04% | |
| Price / MA20: | +1.45% | |
| Price / MA50: | +2.31% | |
| Price / MA100: | -0.05% | |
| Price / MAexp7: | -0.05% | |
| Price / MAexp20: | +0.16% | |
| Price / MAexp50: | +0.51% | |
| Price / MAexp100: | +0.77% |
News
Don't forget to follow the news on EUR/JPY. At the time of publication of this analysis, the latest news was as follows:
-
 EUR/JPY Forecast October 2, 2024
-
EUR/JPY Forecast September 20, 2024
-
EUR/JPY Forecast September 18, 2024
-
EUR/JPY Forecast September 3, 2024
-
EUR/JPY Forecast August 28, 2024
About author

Online


Add a comment
Comments
0 comments on the analysis EUR/JPY - 1H