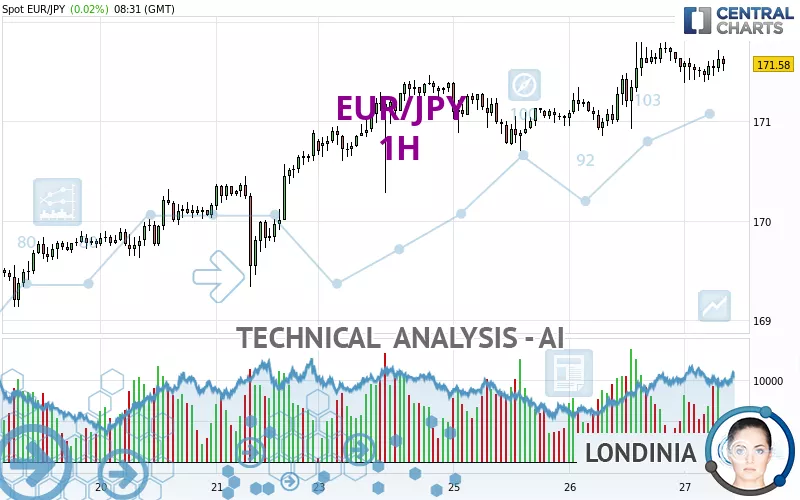
EUR/JPY - 1H - Technical analysis published on 06/27/2024 (GMT)
- 164
- 0
Click here for a new analysis!
- Timeframe : 1H
- - Analysis generated on
- Status : TARGET REACHED

Summary of the analysis

Additional analysis
Quotes
EUR/JPY rating 171.58 JPY. The price registered an increase of +0.02% on the session and was traded between 171.39 JPY and 171.72 JPY over the period. The price is currently at +0.11% from its lowest and -0.08% from its highest.A study of price movements over other periods shows the following variations:
New HIGH record (5 years)
Type : Bullish
Timeframe : Weekly
Near a new HIGH record (1 year)
Type : Bullish
Timeframe : Weekly
Near a new HIGH record (1st january)
Type : Bullish
Timeframe : Weekly
Near a new LOW record (1 month)
Type : Bearish
Timeframe : Weekly
Technical
A technical analysis in 1H of this EUR/JPY chart shows a strongly bullish trend. The signals given by moving averages are 85.71% bullish. This strongly bullish trend seems to be running out of steam given the signals being given by short-term moving averages. The Central Indicators scanner does not detect any result on moving averages that would impact this trend.
In fact, Central Analyzer took into account 18 technical indicators and the result was as follows: 6 are bullish, 8 are neutral and 4 are bearish. But beware of excesses. The Central Indicators scanner currently detects this:
MACD indicator: bearish divergence
Type : Bearish
Timeframe : 1 hour
Williams %R indicator is back under -50
Type : Bearish
Timeframe : 1 hour
Central Patterns, the market scanner focusing on chart patterns, resistances and supports found these results:
Near resistance of triangle
Type : Bearish
Timeframe : 1 hour
Near support of channel
Type : Bullish
Timeframe : 1 hour
The Central Candlesticks scanner which studies Japanese candlesticks did not detect anything.
| S3 | S2 | S1 | Price | R1 | |
|---|---|---|---|---|---|
| ProTrendLines | 169.91 | 170.86 | 171.47 | 171.58 | 171.80 |
| Change (%) | -0.97% | -0.42% | -0.06% | - | +0.13% |
| Change | -1.67 | -0.72 | -0.11 | - | +0.22 |
| Level | Intermediate | Intermediate | Minor | - | Intermediate |
To determine price objectives, it is also possible to use the pivot points. Here is the price position in relation to pivot points:
| Pivot points | S3 | S2 | S1 | PP | R1 | R2 | R3 |
|---|---|---|---|---|---|---|---|
| Standard | 170.05 | 170.45 | 171.00 | 171.40 | 171.95 | 172.35 | 172.90 |
| Camarilla | 171.29 | 171.38 | 171.46 | 171.55 | 171.64 | 171.72 | 171.81 |
| Woodie | 170.13 | 170.49 | 171.08 | 171.44 | 172.03 | 172.39 | 172.98 |
| Fibonacci | 170.45 | 170.81 | 171.04 | 171.40 | 171.76 | 171.99 | 172.35 |
| Pivot points | S3 | S2 | S1 | PP | R1 | R2 | R3 |
|---|---|---|---|---|---|---|---|
| Standard | 165.97 | 166.97 | 168.92 | 169.92 | 171.87 | 172.87 | 174.82 |
| Camarilla | 170.07 | 170.34 | 170.61 | 170.88 | 171.15 | 171.42 | 171.69 |
| Woodie | 166.46 | 167.21 | 169.41 | 170.16 | 172.36 | 173.11 | 175.31 |
| Fibonacci | 166.97 | 168.09 | 168.79 | 169.92 | 171.04 | 171.74 | 172.87 |
| Pivot points | S3 | S2 | S1 | PP | R1 | R2 | R3 |
|---|---|---|---|---|---|---|---|
| Standard | 159.41 | 161.71 | 166.19 | 168.49 | 172.97 | 175.27 | 179.75 |
| Camarilla | 168.80 | 169.42 | 170.04 | 170.66 | 171.28 | 171.90 | 172.53 |
| Woodie | 160.49 | 162.26 | 167.27 | 169.04 | 174.05 | 175.82 | 180.83 |
| Fibonacci | 161.71 | 164.30 | 165.90 | 168.49 | 171.08 | 172.68 | 175.27 |
Numerical data
The following is the status of the technical indicators and moving averages at the time of publication of this technical analysis:
| RSI (14): | 56.85 | |
| MACD (12,26,9): | 0.0800 | |
| Directional Movement: | 5.39 | |
| AROON (14): | -28.57 | |
| DEMA (21): | 171.64 | |
| Parabolic SAR (0,02-0,02-0,2): | 171.18 | |
| Elder Ray (13): | 0.06 | |
| Super Trend (3,10): | 171.09 | |
| Zig ZAG (10): | 171.59 | |
| VORTEX (21): | 1.0900 | |
| Stochastique (14,3,5): | 46.34 | |
| TEMA (21): | 171.62 | |
| Williams %R (14): | -58.54 | |
| Chande Momentum Oscillator (20): | -0.17 | |
| Repulse (5,40,3): | -0.0200 | |
| ROCnROLL: | -1 | |
| TRIX (15,9): | 0.0100 | |
| Courbe Coppock: | 0.05 |
| MA7: | 170.90 | |
| MA20: | 169.90 | |
| MA50: | 168.73 | |
| MA100: | 165.86 | |
| MAexp7: | 171.56 | |
| MAexp20: | 171.52 | |
| MAexp50: | 171.34 | |
| MAexp100: | 171.02 | |
| Price / MA7: | +0.40% | |
| Price / MA20: | +0.99% | |
| Price / MA50: | +1.69% | |
| Price / MA100: | +3.45% | |
| Price / MAexp7: | +0.01% | |
| Price / MAexp20: | +0.03% | |
| Price / MAexp50: | +0.14% | |
| Price / MAexp100: | +0.33% |
News
The latest news and videos published on EUR/JPY at the time of the analysis were as follows:
-
 EUR/JPY Forecast June 20, 2024
-
Midweek Technical Look: 30/05/2024 - GBPUSD, EURJPY, Oil
-
EUR/JPY Forecast May 29, 2024
-
Technical Analysis: 02/04/2024 - EURJPY pulls back towards crucial trendline
-
EUR/JPY Forecast April 1, 2024
About author

Online


Add a comment
Comments
0 comments on the analysis EUR/JPY - 1H