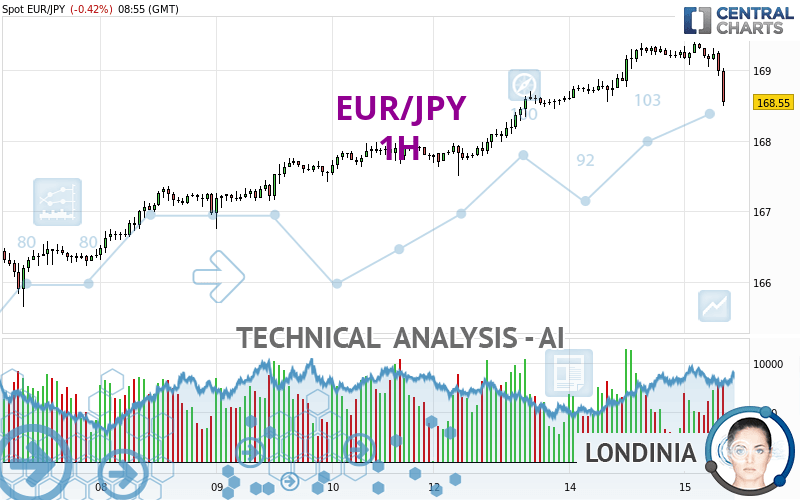
EUR/JPY - 1H - Technical analysis published on 05/15/2024 (GMT)
- 72
- 0
Click here for a new analysis!
- Timeframe : 1H
- - Analysis generated on
- Status : TARGET REACHED

Summary of the analysis

Additional analysis
Quotes
EUR/JPY rating 168.56 JPY. The price is lower by -0.41% since the last closing with the lowest point at 168.49 JPY and the highest point at 169.40 JPY. The deviation from the price is +0.04% for the low point and -0.50% for the high point.So that you have an overall view of the price change, here is a table showing the variations over several periods:
Near a new HIGH record (5 years)
Type : Bullish
Timeframe : Weekly
Near a new HIGH record (1 year)
Type : Bullish
Timeframe : Weekly
Near a new HIGH record (1st january)
Type : Bullish
Timeframe : Weekly
Near a new LOW record (1 month)
Type : Bearish
Timeframe : Weekly
Technical
Technical analysis of EUR/JPY in 1H shows an overall slightly bullish trend. 57.14% of the signals given by moving averages are bullish. Caution: the strong bearish signals currently being given by short-term moving averages indicate that this slightly bullish trend could be reversed. An assessment of moving averages reveals several bearish signals that could impact this trend:
Bearish trend reversal : adaptative moving average 20
Type : Bearish
Timeframe : 1 hour
Bearish price crossover with Moving Average 50
Type : Bearish
Timeframe : 1 hour
Technical indicators are bearish. There is still some doubt about the decline in the price.
But beware of excesses. The Central Indicators scanner currently detects this:
CCI indicator is oversold : under -100
Type : Neutral
Timeframe : 1 hour
Williams %R indicator is oversold : under -80
Type : Neutral
Timeframe : 1 hour
Pivot points : price is under support 1
Type : Neutral
Timeframe : 1 hour
SuperTrend indicator bearish reversal
Type : Bearish
Timeframe : 1 hour
An analysis of the price chart with the Central Patterns scanner (detector of chart patterns and resistances and supports) shows several results that can have an impact on the price change:
Near horizontal support
Type : Bullish
Timeframe : 1 hour
Support of channel is broken
Type : Bearish
Timeframe : 1 hour
The Central Candlesticks scanner, specialised in Japanese candlesticks, did not identify any signals.
| S3 | S2 | S1 | Price | R1 | |
|---|---|---|---|---|---|
| ProTrendLines | 165.65 | 167.50 | 168.55 | 168.56 | 169.54 |
| Change (%) | -1.73% | -0.63% | -0.01% | - | +0.58% |
| Change | -2.91 | -1.06 | -0.01 | - | +0.98 |
| Level | Minor | Intermediate | Intermediate | - | Major |
Attention could also be paid to pivot points to set price objectives:
| Pivot points | S3 | S2 | S1 | PP | R1 | R2 | R3 |
|---|---|---|---|---|---|---|---|
| Standard | 167.90 | 168.23 | 168.74 | 169.07 | 169.58 | 169.91 | 170.42 |
| Camarilla | 169.03 | 169.11 | 169.18 | 169.26 | 169.34 | 169.41 | 169.49 |
| Woodie | 168.00 | 168.28 | 168.84 | 169.12 | 169.68 | 169.96 | 170.52 |
| Fibonacci | 168.23 | 168.55 | 168.75 | 169.07 | 169.39 | 169.59 | 169.91 |
| Pivot points | S3 | S2 | S1 | PP | R1 | R2 | R3 |
|---|---|---|---|---|---|---|---|
| Standard | 161.95 | 163.20 | 165.49 | 166.74 | 169.03 | 170.28 | 172.57 |
| Camarilla | 166.82 | 167.14 | 167.47 | 167.79 | 168.12 | 168.44 | 168.76 |
| Woodie | 162.48 | 163.46 | 166.02 | 167.00 | 169.56 | 170.54 | 173.10 |
| Fibonacci | 163.20 | 164.55 | 165.38 | 166.74 | 168.09 | 168.92 | 170.28 |
| Pivot points | S3 | S2 | S1 | PP | R1 | R2 | R3 |
|---|---|---|---|---|---|---|---|
| Standard | 153.81 | 158.04 | 163.16 | 167.39 | 172.51 | 176.74 | 181.86 |
| Camarilla | 165.71 | 166.57 | 167.42 | 168.28 | 169.14 | 169.99 | 170.85 |
| Woodie | 154.26 | 158.26 | 163.61 | 167.61 | 172.96 | 176.96 | 182.31 |
| Fibonacci | 158.04 | 161.61 | 163.82 | 167.39 | 170.96 | 173.17 | 176.74 |
Numerical data
The following is the status of the technical indicators and moving averages at the time of publication of this technical analysis:
| RSI (14): | 32.55 | |
| MACD (12,26,9): | 0.0500 | |
| Directional Movement: | -19.07 | |
| AROON (14): | -42.86 | |
| DEMA (21): | 169.19 | |
| Parabolic SAR (0,02-0,02-0,2): | 169.37 | |
| Elder Ray (13): | -0.32 | |
| Super Trend (3,10): | 169.39 | |
| Zig ZAG (10): | 168.52 | |
| VORTEX (21): | 0.9200 | |
| Stochastique (14,3,5): | 22.37 | |
| TEMA (21): | 169.05 | |
| Williams %R (14): | -94.51 | |
| Chande Momentum Oscillator (20): | -0.68 | |
| Repulse (5,40,3): | -0.4700 | |
| ROCnROLL: | 2 | |
| TRIX (15,9): | 0.0100 | |
| Courbe Coppock: | 0.19 |
| MA7: | 167.88 | |
| MA20: | 166.75 | |
| MA50: | 164.71 | |
| MA100: | 162.56 | |
| MAexp7: | 169.02 | |
| MAexp20: | 169.08 | |
| MAexp50: | 168.80 | |
| MAexp100: | 168.32 | |
| Price / MA7: | +0.41% | |
| Price / MA20: | +1.09% | |
| Price / MA50: | +2.34% | |
| Price / MA100: | +3.69% | |
| Price / MAexp7: | -0.28% | |
| Price / MAexp20: | -0.31% | |
| Price / MAexp50: | -0.15% | |
| Price / MAexp100: | +0.14% |
News
The latest news and videos published on EUR/JPY at the time of the analysis were as follows:
-
 Technical Analysis: 02/04/2024 - EURJPY pulls back towards crucial trendline
-
EUR/JPY Forecast April 1, 2024
-
Technical Analysis: 27/03/2024 - Will EURJPY re-test the 16-year high soon?
-
Technical Analysis: 12/03/2024 - EURJPY drops below ascending channel
-
Technical Analysis: 05/03/2024 - EURJPY recovers from mild pullback
About author

Online


Add a comment
Comments
0 comments on the analysis EUR/JPY - 1H