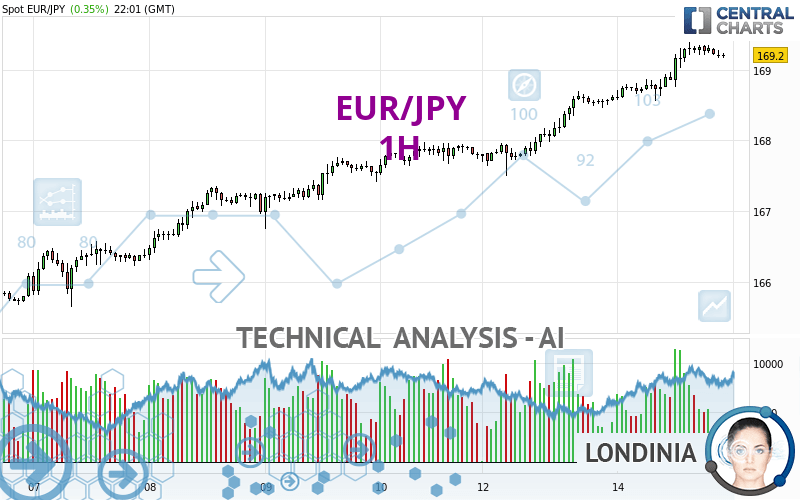
EUR/JPY - 1H - Technical analysis published on 05/14/2024 (GMT)
- 70
- 0
Click here for a new analysis!
- Timeframe : 1H
- - Analysis generated on
- Status : INVALID

Summary of the analysis

Additional analysis
Quotes
The EUR/JPY price is 169.20 JPY. The price has increased by +0.35% since the last closing with the lowest point at 168.55 JPY and the highest point at 169.39 JPY. The deviation from the price is +0.39% for the low point and -0.11% for the high point.A study of price movements over other periods shows the following variations:
Near a new HIGH record (5 years)
Type : Bullish
Timeframe : Weekly
Near a new HIGH record (1 year)
Type : Bullish
Timeframe : Weekly
Near a new HIGH record (1st january)
Type : Bullish
Timeframe : Weekly
Near a new LOW record (1 month)
Type : Bearish
Timeframe : Weekly
Technical
Technical analysis of EUR/JPY in 1H shows a strongly overall bullish trend. 92.86% of the signals given by moving averages are bullish. The overall trend is supported by the strong bullish signals from short-term moving averages. The Central Indicators market scanner is currently detecting a bearish signal that could impact this trend:
Bearish price crossover with adaptative moving average 20
Type : Bearish
Timeframe : 1 hour
An assessment of technical indicators shows a slightly bullish signal.
Central Indicators, the detector scanner for these technical indicators has recently detected several signals:
Pivot points : price is over resistance 1
Type : Neutral
Timeframe : 1 hour
Pivot points : price is over resistance 1
Type : Neutral
Timeframe : Weekly
MACD crosses DOWN its Moving Average
Type : Bearish
Timeframe : 1 hour
The Central Patterns scanner, which studies chart patterns, resistances and supports, has identified these signals:
Near horizontal resistance
Type : Bearish
Timeframe : 1 hour
Resistance of channel is broken
Type : Bullish
Timeframe : 1 hour
The Central Candlesticks scanner, specialised in Japanese candlesticks, did not identify any signals.
| S3 | S2 | S1 | Price | R1 | |
|---|---|---|---|---|---|
| ProTrendLines | 165.65 | 167.50 | 168.70 | 169.20 | 169.54 |
| Change (%) | -2.10% | -1.00% | -0.30% | - | +0.20% |
| Change | -3.55 | -1.70 | -0.50 | - | +0.34 |
| Level | Minor | Intermediate | Intermediate | - | Major |
To determine price objectives, it is also possible to use the pivot points. Here is the price position in relation to pivot points:
| Pivot points | S3 | S2 | S1 | PP | R1 | R2 | R3 |
|---|---|---|---|---|---|---|---|
| Standard | 166.64 | 167.07 | 167.84 | 168.27 | 169.04 | 169.47 | 170.24 |
| Camarilla | 168.28 | 168.39 | 168.50 | 168.61 | 168.72 | 168.83 | 168.94 |
| Woodie | 166.81 | 167.16 | 168.01 | 168.36 | 169.21 | 169.56 | 170.41 |
| Fibonacci | 167.07 | 167.53 | 167.81 | 168.27 | 168.73 | 169.01 | 169.47 |
| Pivot points | S3 | S2 | S1 | PP | R1 | R2 | R3 |
|---|---|---|---|---|---|---|---|
| Standard | 161.95 | 163.20 | 165.49 | 166.74 | 169.03 | 170.28 | 172.57 |
| Camarilla | 166.82 | 167.14 | 167.47 | 167.79 | 168.12 | 168.44 | 168.76 |
| Woodie | 162.48 | 163.46 | 166.02 | 167.00 | 169.56 | 170.54 | 173.10 |
| Fibonacci | 163.20 | 164.55 | 165.38 | 166.74 | 168.09 | 168.92 | 170.28 |
| Pivot points | S3 | S2 | S1 | PP | R1 | R2 | R3 |
|---|---|---|---|---|---|---|---|
| Standard | 153.81 | 158.04 | 163.16 | 167.39 | 172.51 | 176.74 | 181.86 |
| Camarilla | 165.71 | 166.57 | 167.42 | 168.28 | 169.14 | 169.99 | 170.85 |
| Woodie | 154.26 | 158.26 | 163.61 | 167.61 | 172.96 | 176.96 | 182.31 |
| Fibonacci | 158.04 | 161.61 | 163.82 | 167.39 | 170.96 | 173.17 | 176.74 |
Numerical data
The following are the details of the technical indicators and moving averages that were collected to generate this technical analysis:
| RSI (14): | 69.16 | |
| MACD (12,26,9): | 0.2200 | |
| Directional Movement: | 12.58 | |
| AROON (14): | 50.00 | |
| DEMA (21): | 169.32 | |
| Parabolic SAR (0,02-0,02-0,2): | 169.03 | |
| Elder Ray (13): | 0.09 | |
| Super Trend (3,10): | 168.79 | |
| Zig ZAG (10): | 169.19 | |
| VORTEX (21): | 1.1700 | |
| Stochastique (14,3,5): | 82.14 | |
| TEMA (21): | 169.35 | |
| Williams %R (14): | -23.81 | |
| Chande Momentum Oscillator (20): | 0.44 | |
| Repulse (5,40,3): | -0.0500 | |
| ROCnROLL: | 1 | |
| TRIX (15,9): | 0.0200 | |
| Courbe Coppock: | 0.60 |
| MA7: | 167.51 | |
| MA20: | 166.56 | |
| MA50: | 164.59 | |
| MA100: | 162.44 | |
| MAexp7: | 169.22 | |
| MAexp20: | 169.03 | |
| MAexp50: | 168.62 | |
| MAexp100: | 168.13 | |
| Price / MA7: | +1.01% | |
| Price / MA20: | +1.59% | |
| Price / MA50: | +2.80% | |
| Price / MA100: | +4.16% | |
| Price / MAexp7: | -0.01% | |
| Price / MAexp20: | +0.10% | |
| Price / MAexp50: | +0.34% | |
| Price / MAexp100: | +0.64% |
News
The latest news and videos published on EUR/JPY at the time of the analysis were as follows:
-
 Technical Analysis: 02/04/2024 - EURJPY pulls back towards crucial trendline
-
EUR/JPY Forecast April 1, 2024
-
Technical Analysis: 27/03/2024 - Will EURJPY re-test the 16-year high soon?
-
Technical Analysis: 12/03/2024 - EURJPY drops below ascending channel
-
Technical Analysis: 05/03/2024 - EURJPY recovers from mild pullback
About author

Online


Add a comment
Comments
0 comments on the analysis EUR/JPY - 1H