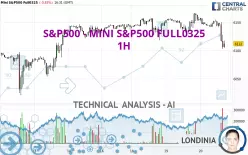
S&P500 - MINI S&P500 FULL0625 - 1H - Technical analysis published on 02/20/2025 (GMT)
- 90
- 0
Click here for a new analysis!
- Timeframe : 1H
- - Analysis generated on
- Status : LEVEL MAINTAINED

Summary of the analysis

Additional analysis
Quotes
S&P500 - MINI S&P500 FULL0325 rating 6,112.00 USD. The price registered a decrease of -0.83% on the session and was traded between 6,102.75 USD and 6,159.50 USD over the period. The price is currently at +0.15% from its lowest and -0.77% from its highest.The Central Gaps scanner detects a bearish opening marking the presence of sellers ahead of buyers at the opening but not sufficiently marked to allow the price to register a quotation gap.
Bearish opening
Type : Bearish
Timeframe : Openning
So that you have an overall view of the price change, here is a table showing the variations over several periods:
Near a new HIGH record (5 years)
Type : Bullish
Timeframe : Weekly
Near a new HIGH record (1 year)
Type : Bullish
Timeframe : Weekly
Near a new LOW record (1st january)
Type : Bearish
Timeframe : Weekly
Near a new LOW record (1 month)
Type : Bearish
Timeframe : Weekly
Technical
A technical analysis in 1H of this S&P500 - MINI S&P500 FULL0325 chart shows a bearish trend. 78.57% of the signals given by moving averages are bearish. This bearish trend is supported by the strong bearish signals given by short-term moving averages. An assessment of moving averages reveals several bearish signals that could impact this trend:
Moving Average bearish crossovers : MA20 & MA50
Type : Bearish
Timeframe : 1 hour
Moving Average bearish crossovers : AMA50 & AMA100
Type : Bearish
Timeframe : 1 hour
An assessment of technical indicators does not currently provide any relevant information on the direction of future price movements.
But beware of excesses. The Central Indicators scanner currently detects this:
CCI indicator is oversold : under -100
Type : Neutral
Timeframe : 1 hour
Previous candle closed under Bollinger bands
Type : Neutral
Timeframe : 1 hour
Williams %R indicator is oversold : under -80
Type : Neutral
Timeframe : 1 hour
Pivot points : price is under support 3
Type : Neutral
Timeframe : 1 hour
Central Patterns, the scanner specializing in chart patterns, did not identify any signals.
For a small rebound in the very short term, the Central Candlesticks scanner currently notes the presence of these bullish patterns in Japanese candlesticks:
Bullish harami
Type : Bullish
Timeframe : 1 hour
Bullish harami cross
Type : Bullish
Timeframe : 1 hour
| S3 | S2 | S1 | Price | R1 | R2 | |
|---|---|---|---|---|---|---|
| ProTrendLines | 6,022.06 | 6,057.75 | 6,098.50 | 6,112.00 | 6,157.35 | 6,169.25 |
| Change (%) | -1.47% | -0.89% | -0.22% | - | +0.74% | +0.94% |
| Change | -89.94 | -54.25 | -13.50 | - | +45.35 | +57.25 |
| Level | Major | Minor | Major | - | Intermediate | Major |
Pivot points can also be used to set your price objectives. Here is the price situation in relation to pivot points:
| Pivot points | S3 | S2 | S1 | PP | R1 | R2 | R3 |
|---|---|---|---|---|---|---|---|
| Standard | 6,102.08 | 6,115.67 | 6,139.33 | 6,152.92 | 6,176.58 | 6,190.17 | 6,213.83 |
| Camarilla | 6,152.76 | 6,156.17 | 6,159.59 | 6,163.00 | 6,166.42 | 6,169.83 | 6,173.24 |
| Woodie | 6,107.13 | 6,118.19 | 6,144.38 | 6,155.44 | 6,181.63 | 6,192.69 | 6,218.88 |
| Fibonacci | 6,115.67 | 6,129.90 | 6,138.69 | 6,152.92 | 6,167.15 | 6,175.94 | 6,190.17 |
| Pivot points | S3 | S2 | S1 | PP | R1 | R2 | R3 |
|---|---|---|---|---|---|---|---|
| Standard | 5,915.67 | 5,964.83 | 6,048.42 | 6,097.58 | 6,181.17 | 6,230.33 | 6,313.92 |
| Camarilla | 6,095.49 | 6,107.66 | 6,119.83 | 6,132.00 | 6,144.17 | 6,156.34 | 6,168.51 |
| Woodie | 5,932.88 | 5,973.44 | 6,065.63 | 6,106.19 | 6,198.38 | 6,238.94 | 6,331.13 |
| Fibonacci | 5,964.83 | 6,015.54 | 6,046.87 | 6,097.58 | 6,148.29 | 6,179.62 | 6,230.33 |
| Pivot points | S3 | S2 | S1 | PP | R1 | R2 | R3 |
|---|---|---|---|---|---|---|---|
| Standard | 5,510.17 | 5,659.58 | 5,863.42 | 6,012.83 | 6,216.67 | 6,366.08 | 6,569.92 |
| Camarilla | 5,970.11 | 6,002.49 | 6,034.87 | 6,067.25 | 6,099.63 | 6,132.01 | 6,164.39 |
| Woodie | 5,537.38 | 5,673.19 | 5,890.63 | 6,026.44 | 6,243.88 | 6,379.69 | 6,597.13 |
| Fibonacci | 5,659.58 | 5,794.53 | 5,877.89 | 6,012.83 | 6,147.78 | 6,231.14 | 6,366.08 |
Numerical data
The following is the status of the technical indicators and moving averages at the time of publication of this technical analysis:
| RSI (14): | 29.48 | |
| MACD (12,26,9): | -7.2200 | |
| Directional Movement: | -27.69 | |
| AROON (14): | -35.72 | |
| DEMA (21): | 6,131.08 | |
| Parabolic SAR (0,02-0,02-0,2): | 6,150.50 | |
| Elder Ray (13): | -23.10 | |
| Super Trend (3,10): | 6,144.91 | |
| Zig ZAG (10): | 6,111.50 | |
| VORTEX (21): | 0.8200 | |
| Stochastique (14,3,5): | 9.38 | |
| TEMA (21): | 6,124.87 | |
| Williams %R (14): | -78.95 | |
| Chande Momentum Oscillator (20): | -31.50 | |
| Repulse (5,40,3): | -0.4100 | |
| ROCnROLL: | 2 | |
| TRIX (15,9): | -0.0100 | |
| Courbe Coppock: | 0.71 |
| MA7: | 6,129.61 | |
| MA20: | 6,096.20 | |
| MA50: | 6,048.18 | |
| MA100: | 6,023.89 | |
| MAexp7: | 6,126.30 | |
| MAexp20: | 6,138.23 | |
| MAexp50: | 6,142.39 | |
| MAexp100: | 6,136.85 | |
| Price / MA7: | -0.29% | |
| Price / MA20: | +0.26% | |
| Price / MA50: | +1.06% | |
| Price / MA100: | +1.46% | |
| Price / MAexp7: | -0.23% | |
| Price / MAexp20: | -0.43% | |
| Price / MAexp50: | -0.49% | |
| Price / MAexp100: | -0.40% |
About author

Online


Add a comment
Comments
0 comments on the analysis S&P500 - MINI S&P500 FULL0625 - 1H