S&P500 - MINI S&P500 FULL0625 - Daily - Technical analysis published on 09/04/2024 (GMT)
- 101
- 0
- Timeframe : Daily
- - Analysis generated on
- Status : NEUTRAL
Summary of the analysis

Additional analysis
Quotes
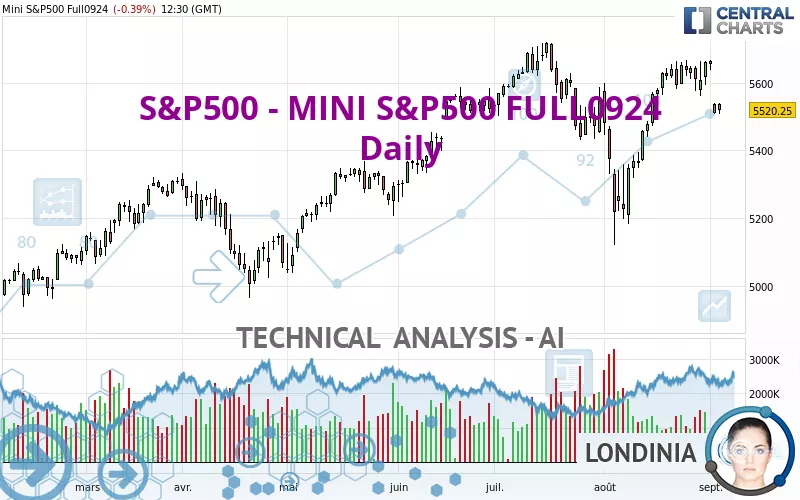
The S&P500 - MINI S&P500 FULL0924 rating is 5,520.25 USD. The price is lower by -0.39% since the last closing and was traded between 5,506.75 USD and 5,541.00 USD over the period. The price is currently at +0.25% from its lowest and -0.37% from its highest.The Central Gaps scanner detects a bearish opening marking the presence of sellers ahead of buyers at the opening but not sufficiently marked to allow the price to register a quotation gap.
Bearish opening
Type : Bearish
Timeframe : Openning
Here is a more detailed summary of the historical variations registered by S&P500 - MINI S&P500 FULL0924:
Near a new HIGH record (5 years)
Type : Bullish
Timeframe : Weekly
Near a new HIGH record (1 year)
Type : Bullish
Timeframe : Weekly
Near a new HIGH record (1st january)
Type : Bullish
Timeframe : Weekly
Near a new HIGH record (1 month)
Type : Bullish
Timeframe : Weekly
Technical
A technical analysis in Daily of this S&P500 - MINI S&P500 FULL0924 chart shows a slightly bullish trend. 53.57% of the signals given by moving averages are bullish. Caution: the slightly bearish signals currently given by short-term moving averages indicate that this slightly bullish trend could be reversed. An assessment of moving averages reveals several bearish and bullish signals:
Bearish trend reversal : adaptative moving average 20
Type : Bearish
Timeframe : Daily
Moving Average bullish crossovers : MA20 & MA50
Type : Bullish
Timeframe : Daily
An assessment of technical indicators does not currently provide any relevant information to suggest whether the signal given by the technical indicators is more bullish or bearish.
But beware of excesses. The Central Indicators scanner currently detects this:
Williams %R indicator is oversold : under -80
Type : Neutral
Timeframe : Daily
Pivot points : price is under support 3
Type : Neutral
Timeframe : Weekly
MACD crosses DOWN its Moving Average
Type : Bearish
Timeframe : Daily
No signals are given by Central Patterns, a market scanner specialised in chart patterns, resistances and supports.
The presence of a bullish Japanese candlestick pattern detected by Central Candlesticks that could cause a very short term rebound was also detected:
Bullish doji star
Type : Bullish
Timeframe : Daily
| S3 | S2 | S1 | Price | R1 | R2 | |
|---|---|---|---|---|---|---|
| ProTrendLines | 5,138.25 | 5,216.60 | 5,372.33 | 5,520.25 | 5,560.50 | 5,717.25 |
| Change (%) | -6.92% | -5.50% | -2.68% | - | +0.73% | +3.57% |
| Change | -382.00 | -303.65 | -147.92 | - | +40.25 | +197.00 |
| Level | Major | Intermediate | Intermediate | - | Intermediate | Major |
Attention could also be paid to pivot points to set price objectives:
| Pivot points | S3 | S2 | S1 | PP | R1 | R2 | R3 |
|---|---|---|---|---|---|---|---|
| Standard | 5,329.42 | 5,423.08 | 5,482.42 | 5,576.08 | 5,635.42 | 5,729.08 | 5,788.42 |
| Camarilla | 5,499.68 | 5,513.70 | 5,527.73 | 5,541.75 | 5,555.78 | 5,569.80 | 5,583.83 |
| Woodie | 5,312.25 | 5,414.50 | 5,465.25 | 5,567.50 | 5,618.25 | 5,720.50 | 5,771.25 |
| Fibonacci | 5,423.08 | 5,481.53 | 5,517.64 | 5,576.08 | 5,634.53 | 5,670.64 | 5,729.08 |
| Pivot points | S3 | S2 | S1 | PP | R1 | R2 | R3 |
|---|---|---|---|---|---|---|---|
| Standard | 5,484.08 | 5,522.67 | 5,591.83 | 5,630.42 | 5,699.58 | 5,738.17 | 5,807.33 |
| Camarilla | 5,631.37 | 5,641.25 | 5,651.12 | 5,661.00 | 5,670.88 | 5,680.75 | 5,690.63 |
| Woodie | 5,499.38 | 5,530.31 | 5,607.13 | 5,638.06 | 5,714.88 | 5,745.81 | 5,822.63 |
| Fibonacci | 5,522.67 | 5,563.83 | 5,589.26 | 5,630.42 | 5,671.58 | 5,697.01 | 5,738.17 |
| Pivot points | S3 | S2 | S1 | PP | R1 | R2 | R3 |
|---|---|---|---|---|---|---|---|
| Standard | 4,748.67 | 4,934.33 | 5,297.67 | 5,483.33 | 5,846.67 | 6,032.33 | 6,395.67 |
| Camarilla | 5,510.03 | 5,560.35 | 5,610.68 | 5,661.00 | 5,711.33 | 5,761.65 | 5,811.98 |
| Woodie | 4,837.50 | 4,978.75 | 5,386.50 | 5,527.75 | 5,935.50 | 6,076.75 | 6,484.50 |
| Fibonacci | 4,934.33 | 5,144.05 | 5,273.62 | 5,483.33 | 5,693.05 | 5,822.62 | 6,032.33 |
Numerical data
The following is the status of the technical indicators and moving averages at the time of publication of this technical analysis:
| RSI (14): | 46.46 | |
| MACD (12,26,9): | 27.3100 | |
| Directional Movement: | -14.02 | |
| AROON (14): | 92.86 | |
| DEMA (21): | 5,604.31 | |
| Parabolic SAR (0,02-0,02-0,2): | 5,669.75 | |
| Elder Ray (13): | -60.60 | |
| Super Trend (3,10): | 5,437.21 | |
| Zig ZAG (10): | 5,519.50 | |
| VORTEX (21): | 1.1800 | |
| Stochastique (14,3,5): | 47.25 | |
| TEMA (21): | 5,621.55 | |
| Williams %R (14): | -91.72 | |
| Chande Momentum Oscillator (20): | -109.25 | |
| Repulse (5,40,3): | -1.5200 | |
| ROCnROLL: | -1 | |
| TRIX (15,9): | 0.0800 | |
| Courbe Coppock: | 4.91 |
| MA7: | 5,607.57 | |
| MA20: | 5,559.88 | |
| MA50: | 5,546.54 | |
| MA100: | 5,448.77 | |
| MAexp7: | 5,588.68 | |
| MAexp20: | 5,569.30 | |
| MAexp50: | 5,527.79 | |
| MAexp100: | 5,445.10 | |
| Price / MA7: | -1.56% | |
| Price / MA20: | -0.71% | |
| Price / MA50: | -0.47% | |
| Price / MA100: | +1.31% | |
| Price / MAexp7: | -1.22% | |
| Price / MAexp20: | -0.88% | |
| Price / MAexp50: | -0.14% | |
| Price / MAexp100: | +1.38% |
About author

Online


Add a comment
Comments
0 comments on the analysis S&P500 - MINI S&P500 FULL0625 - Daily