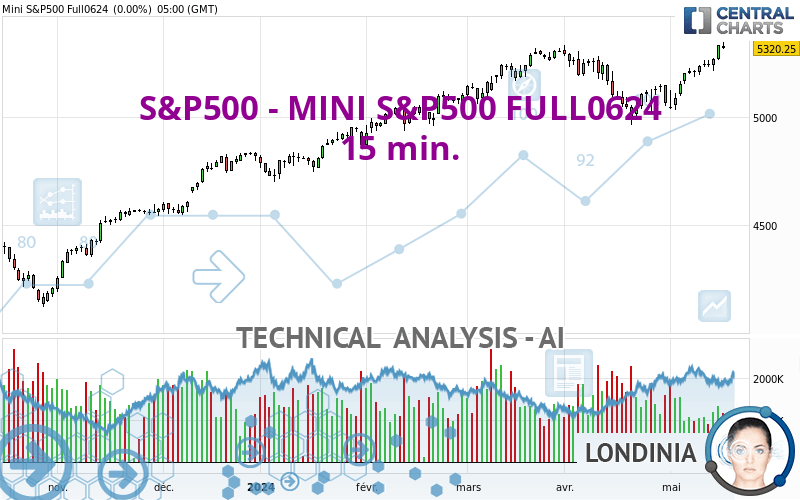
S&P500 - MINI S&P500 FULL0624 - 15 min. - Technical analysis published on 05/17/2024 (GMT)
- 61
- 0
Click here for a new analysis!
- Timeframe : 15 min.
- - Analysis generated on
- Status : TARGET REACHED

Summary of the analysis

Additional analysis
Quotes
The S&P500 - MINI S&P500 FULL0624 rating is 5,318.75 USD. The price registered a decrease of -0.03% on the session with the lowest point at 5,313.25 USD and the highest point at 5,326.00 USD. The deviation from the price is +0.10% for the low point and -0.14% for the high point.The Central Gaps scanner detects a bearish opening marking the presence of sellers ahead of buyers at the opening but not sufficiently marked to allow the price to register a quotation gap.
Bearish opening
Type : Bearish
Timeframe : Openning
Here is a more detailed summary of the historical variations registered by S&P500 - MINI S&P500 FULL0624:
New HIGH record (5 years)
Type : Bullish
Timeframe : Weekly
Near a new HIGH record (1 year)
Type : Bullish
Timeframe : Weekly
Near a new HIGH record (1st january)
Type : Bullish
Timeframe : Weekly
Near a new HIGH record (1 month)
Type : Bullish
Timeframe : Weekly
Technical
Technical analysis of this 15 min. chart of S&P500 - MINI S&P500 FULL0624 indicates that the overall trend is slightly bearish. 53.57% of the signals given by moving averages are bearish. This bearish trend does not seem to be increasing given the slightly bearish signals given by short-term moving averages. An assessment of moving averages reveals several bearish and bullish signals:
Moving Average bullish crossovers : MA20 & MA50
Type : Bullish
Timeframe : 15 minutes
Bearish price crossover with Moving Average 20
Type : Bearish
Timeframe : 15 minutes
Bearish price crossover with Moving Average 50
Type : Bearish
Timeframe : 15 minutes
Bearish price crossover with adaptative moving average 20
Type : Bearish
Timeframe : 15 minutes
Bearish price crossover with adaptative moving average 50
Type : Bearish
Timeframe : 15 minutes
Technical indicators are slightly bullish. There is therefore considerable uncertainty about the continuation of the increase.
Other results related to technical indicators were also found by the Central Indicators scanner:
Pivot points : price is over resistance 1
Type : Neutral
Timeframe : Weekly
RSI indicator is back under 50
Type : Bearish
Timeframe : 15 minutes
Parabolic SAR indicator bearish reversal
Type : Bearish
Timeframe : 15 minutes
Williams %R indicator is back under -50
Type : Bearish
Timeframe : 15 minutes
The analysis of the price chart with Central Patterns scanners does not return any result.
The Central Candlesticks scanner, specialised in Japanese candlesticks, did not identify any signals.
| S3 | S2 | S1 | Price | R1 | |
|---|---|---|---|---|---|
| ProTrendLines | 5,233.00 | 5,264.00 | 5,308.50 | 5,318.75 | 5,349.00 |
| Change (%) | -1.61% | -1.03% | -0.19% | - | +0.57% |
| Change | -85.75 | -54.75 | -10.25 | - | +30.25 |
| Level | Minor | Intermediate | Major | - | Intermediate |
Attention could also be paid to pivot points to set price objectives:
| Pivot points | S3 | S2 | S1 | PP | R1 | R2 | R3 |
|---|---|---|---|---|---|---|---|
| Standard | 5,274.00 | 5,294.75 | 5,307.50 | 5,328.25 | 5,341.00 | 5,361.75 | 5,374.50 |
| Camarilla | 5,311.04 | 5,314.11 | 5,317.18 | 5,320.25 | 5,323.32 | 5,326.39 | 5,329.46 |
| Woodie | 5,270.00 | 5,292.75 | 5,303.50 | 5,326.25 | 5,337.00 | 5,359.75 | 5,370.50 |
| Fibonacci | 5,294.75 | 5,307.55 | 5,315.45 | 5,328.25 | 5,341.05 | 5,348.95 | 5,361.75 |
| Pivot points | S3 | S2 | S1 | PP | R1 | R2 | R3 |
|---|---|---|---|---|---|---|---|
| Standard | 5,071.75 | 5,113.75 | 5,180.00 | 5,222.00 | 5,288.25 | 5,330.25 | 5,396.50 |
| Camarilla | 5,216.48 | 5,226.40 | 5,236.33 | 5,246.25 | 5,256.17 | 5,266.10 | 5,276.02 |
| Woodie | 5,083.88 | 5,119.81 | 5,192.13 | 5,228.06 | 5,300.38 | 5,336.31 | 5,408.63 |
| Fibonacci | 5,113.75 | 5,155.10 | 5,180.65 | 5,222.00 | 5,263.35 | 5,288.90 | 5,330.25 |
| Pivot points | S3 | S2 | S1 | PP | R1 | R2 | R3 |
|---|---|---|---|---|---|---|---|
| Standard | 4,558.83 | 4,761.17 | 4,903.83 | 5,106.17 | 5,248.83 | 5,451.17 | 5,593.83 |
| Camarilla | 4,951.63 | 4,983.25 | 5,014.88 | 5,046.50 | 5,078.13 | 5,109.75 | 5,141.38 |
| Woodie | 4,529.00 | 4,746.25 | 4,874.00 | 5,091.25 | 5,219.00 | 5,436.25 | 5,564.00 |
| Fibonacci | 4,761.17 | 4,892.96 | 4,974.38 | 5,106.17 | 5,237.96 | 5,319.38 | 5,451.17 |
Numerical data
The following are the details of the technical indicators and moving averages that were collected to generate this technical analysis:
| RSI (14): | 54.80 | |
| MACD (12,26,9): | 1.2200 | |
| Directional Movement: | 7.63 | |
| AROON (14): | 71.42 | |
| DEMA (21): | 5,322.54 | |
| Parabolic SAR (0,02-0,02-0,2): | 5,319.50 | |
| Elder Ray (13): | -0.15 | |
| Super Trend (3,10): | 5,317.07 | |
| Zig ZAG (10): | 5,319.25 | |
| VORTEX (21): | 1.0800 | |
| Stochastique (14,3,5): | 69.30 | |
| TEMA (21): | 5,323.09 | |
| Williams %R (14): | -26.32 | |
| Chande Momentum Oscillator (20): | 5.00 | |
| Repulse (5,40,3): | 0.0400 | |
| ROCnROLL: | 1 | |
| TRIX (15,9): | 0.0000 | |
| Courbe Coppock: | 0.18 |
| MA7: | 5,281.86 | |
| MA20: | 5,179.60 | |
| MA50: | 5,201.21 | |
| MA100: | 5,105.53 | |
| MAexp7: | 5,322.06 | |
| MAexp20: | 5,321.66 | |
| MAexp50: | 5,321.63 | |
| MAexp100: | 5,322.34 | |
| Price / MA7: | +0.70% | |
| Price / MA20: | +2.69% | |
| Price / MA50: | +2.26% | |
| Price / MA100: | +4.18% | |
| Price / MAexp7: | -0.06% | |
| Price / MAexp20: | -0.05% | |
| Price / MAexp50: | -0.05% | |
| Price / MAexp100: | -0.07% |
About author

Online


Add a comment
Comments
0 comments on the analysis S&P500 - MINI S&P500 FULL0624 - 15 min.