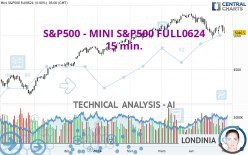
S&P500 - MINI S&P500 FULL0624 - 15 min. - Technical analysis published on 05/02/2024 (GMT)
- 69
- 0
- Timeframe : 15 min.
- - Analysis generated on
- Status : NEUTRAL

Summary of the analysis

Additional analysis
Quotes
The S&P500 - MINI S&P500 FULL0624 price is 5,059.75 USD. On the day, this instrument gained +0.26% and was between 5,056.25 USD and 5,090.00 USD. This implies that the price is at +0.07% from its lowest and at -0.59% from its highest.A bullish opening was detected by the Central Gaps scanner. Buyers are trying to impose a bullish momentum in the very short term.
Bullish opening
Type : Bullish
Timeframe : Openning
So that you have an overall view of the price change, here is a table showing the variations over several periods:
Near a new HIGH record (5 years)
Type : Bullish
Timeframe : Weekly
Near a new HIGH record (1 year)
Type : Bullish
Timeframe : Weekly
Near a new HIGH record (1st january)
Type : Bullish
Timeframe : Weekly
Near a new HIGH record (1 month)
Type : Bullish
Timeframe : Weekly
Technical
Technical analysis of S&P500 - MINI S&P500 FULL0624 in 15 min. shows an overall slightly bullish trend. 60.71% of the signals given by moving averages are bullish. Caution: the slightly bearish signals currently given by short-term moving averages indicate that this slightly bullish trend could be reversed. The Central Indicators scanner detects a bullish signal on moving averages that could impact this trend:
Bullish price crossover with Moving Average 20
Type : Bullish
Timeframe : 15 minutes
In fact, according to the parameters integrated into the Central Analyzer system, only 7 technical indicators out of 18 analysed are currently bullish. Central Indicators, the detector scanner for these technical indicators has recently detected several signals:
Ichimoku : price is under the cloud
Type : Bearish
Timeframe : 15 minutes
SuperTrend indicator bearish reversal
Type : Bearish
Timeframe : 15 minutes
Price is back over the pivot point
Type : Bullish
Timeframe : 15 minutes
Price is back under the pivot point
Type : Bearish
Timeframe : Weekly
Williams %R indicator is back over -50
Type : Bullish
Timeframe : 15 minutes
Central Patterns, the scanner specializing in chart patterns, did not identify any signals.
The presence of a bearish pattern in Japanese candlesticks detected by Central Candlesticks that could cause a correction in the very short term was also detected:
Black gravestone / inverted hammer
Type : Bearish
Timeframe : 15 minutes
| S3 | S2 | S1 | Price | R1 | R2 | R3 | |
|---|---|---|---|---|---|---|---|
| ProTrendLines | 5,006.00 | 5,022.42 | 5,037.62 | 5,059.75 | 5,073.75 | 5,104.90 | 5,128.85 |
| Change (%) | -1.06% | -0.74% | -0.44% | - | +0.28% | +0.89% | +1.37% |
| Change | -53.75 | -37.33 | -22.13 | - | +14.00 | +45.15 | +69.10 |
| Level | Minor | Intermediate | Intermediate | - | Major | Minor | Intermediate |
Pivot points can also be used to set your price objectives. Here is the price situation in relation to pivot points:
| Pivot points | S3 | S2 | S1 | PP | R1 | R2 | R3 |
|---|---|---|---|---|---|---|---|
| Standard | 4,924.92 | 4,981.33 | 5,013.92 | 5,070.33 | 5,102.92 | 5,159.33 | 5,191.92 |
| Camarilla | 5,022.03 | 5,030.18 | 5,038.34 | 5,046.50 | 5,054.66 | 5,062.82 | 5,070.98 |
| Woodie | 4,913.00 | 4,975.38 | 5,002.00 | 5,064.38 | 5,091.00 | 5,153.38 | 5,180.00 |
| Fibonacci | 4,981.33 | 5,015.33 | 5,036.34 | 5,070.33 | 5,104.33 | 5,125.34 | 5,159.33 |
| Pivot points | S3 | S2 | S1 | PP | R1 | R2 | R3 |
|---|---|---|---|---|---|---|---|
| Standard | 4,902.33 | 4,954.17 | 5,042.83 | 5,094.67 | 5,183.33 | 5,235.17 | 5,323.83 |
| Camarilla | 5,092.86 | 5,105.74 | 5,118.62 | 5,131.50 | 5,144.38 | 5,157.26 | 5,170.14 |
| Woodie | 4,920.75 | 4,963.38 | 5,061.25 | 5,103.88 | 5,201.75 | 5,244.38 | 5,342.25 |
| Fibonacci | 4,954.17 | 5,007.84 | 5,041.00 | 5,094.67 | 5,148.34 | 5,181.50 | 5,235.17 |
| Pivot points | S3 | S2 | S1 | PP | R1 | R2 | R3 |
|---|---|---|---|---|---|---|---|
| Standard | 4,558.83 | 4,761.17 | 4,903.83 | 5,106.17 | 5,248.83 | 5,451.17 | 5,593.83 |
| Camarilla | 4,951.63 | 4,983.25 | 5,014.88 | 5,046.50 | 5,078.13 | 5,109.75 | 5,141.38 |
| Woodie | 4,529.00 | 4,746.25 | 4,874.00 | 5,091.25 | 5,219.00 | 5,436.25 | 5,564.00 |
| Fibonacci | 4,761.17 | 4,892.96 | 4,974.38 | 5,106.17 | 5,237.96 | 5,319.38 | 5,451.17 |
Numerical data
The following is the status of technical indicators and moving averages registered at the time this technical analysis was created:
| RSI (14): | 51.15 | |
| MACD (12,26,9): | 1.8400 | |
| Directional Movement: | 13.13 | |
| AROON (14): | 7.14 | |
| DEMA (21): | 5,081.81 | |
| Parabolic SAR (0,02-0,02-0,2): | 5,073.59 | |
| Elder Ray (13): | -0.88 | |
| Super Trend (3,10): | 5,071.32 | |
| Zig ZAG (10): | 5,082.00 | |
| VORTEX (21): | 1.0100 | |
| Stochastique (14,3,5): | 38.31 | |
| TEMA (21): | 5,082.64 | |
| Williams %R (14): | -43.28 | |
| Chande Momentum Oscillator (20): | 6.00 | |
| Repulse (5,40,3): | 0.0000 | |
| ROCnROLL: | 1 | |
| TRIX (15,9): | 0.0100 | |
| Courbe Coppock: | 0.15 |
| MA7: | 5,092.75 | |
| MA20: | 5,124.98 | |
| MA50: | 5,183.52 | |
| MA100: | 5,060.94 | |
| MAexp7: | 5,079.53 | |
| MAexp20: | 5,078.82 | |
| MAexp50: | 5,075.04 | |
| MAexp100: | 5,073.24 | |
| Price / MA7: | -0.65% | |
| Price / MA20: | -1.27% | |
| Price / MA50: | -2.39% | |
| Price / MA100: | -0.02% | |
| Price / MAexp7: | -0.39% | |
| Price / MAexp20: | -0.38% | |
| Price / MAexp50: | -0.30% | |
| Price / MAexp100: | -0.27% |
About author

Online


Add a comment
Comments
0 comments on the analysis S&P500 - MINI S&P500 FULL0624 - 15 min.