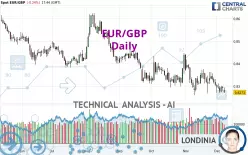
EUR/GBP - Daily - Technical analysis published on 12/09/2024 (GMT)
- 166
- 0
Click here for a new analysis!
- Timeframe : Daily
- - Analysis generated on
- Status : LEVEL MAINTAINED

Summary of the analysis

Additional analysis
Quotes
EUR/GBP rating 0.8273 GBP. On the day, this instrument lost -0.24% and was between 0.8269 GBP and 0.8294 GBP. This implies that the price is at +0.05% from its lowest and at -0.25% from its highest.The Central Gaps scanner detects a bearish opening. A small advantage for sellers in the very short term.
Bearish opening
Type : Bearish
Timeframe : Openning
So that you have an overall view of the price change, here is a table showing the variations over several periods:
Near a new LOW record (5 years)
Type : Bearish
Timeframe : Weekly
Near a new LOW record (1 year)
Type : Bearish
Timeframe : Weekly
Near a new HIGH record (1st january)
Type : Bullish
Timeframe : Weekly
Near a new HIGH record (1 month)
Type : Bullish
Timeframe : Weekly
Technical
Technical analysis of this Daily chart of EUR/GBP indicates that the overall trend is strongly bearish. The signals given by moving averages are 92.86% bearish. This strong bearish trend is confirmed by the strong signals currently being given by short-term moving averages. There is no crossing of moving average by the price or crossing of moving averages between themselves.
In fact, 13 technical indicators on 18 studied are currently positioned bearish. But beware of excesses. The Central Indicators scanner currently detects this:
CCI indicator is oversold : under -100
Type : Neutral
Timeframe : Daily
Williams %R indicator is oversold : under -80
Type : Neutral
Timeframe : Daily
Pivot points : price is under support 1
Type : Neutral
Timeframe : Daily
Central Patterns, the market scanner focusing on chart patterns, resistances and supports found these results:
Near horizontal support
Type : Bullish
Timeframe : Daily
Support of channel is broken
Type : Bearish
Timeframe : Daily
No result was found by the Central Candlesticks scanner on Japanese candlesticks.
| S2 | S1 | Price | R1 | R2 | R3 | |
|---|---|---|---|---|---|---|
| ProTrendLines | 0.6942 | 0.7777 | 0.8273 | 0.8300 | 0.8396 | 0.8440 |
| Change (%) | -16.09% | -6.00% | - | +0.33% | +1.49% | +2.02% |
| Change | -0.1331 | -0.0496 | - | +0.0027 | +0.0123 | +0.0167 |
| Level | Minor | Intermediate | - | Major | Minor | Major |
Pivot points can also be used to set your price objectives. Here is the price situation in relation to pivot points:
| Pivot points | S3 | S2 | S1 | PP | R1 | R2 | R3 |
|---|---|---|---|---|---|---|---|
| Standard | 0.8259 | 0.8269 | 0.8281 | 0.8291 | 0.8303 | 0.8313 | 0.8325 |
| Camarilla | 0.8287 | 0.8289 | 0.8291 | 0.8293 | 0.8295 | 0.8297 | 0.8299 |
| Woodie | 0.8260 | 0.8270 | 0.8282 | 0.8292 | 0.8304 | 0.8314 | 0.8326 |
| Fibonacci | 0.8269 | 0.8277 | 0.8283 | 0.8291 | 0.8299 | 0.8305 | 0.8313 |
| Pivot points | S3 | S2 | S1 | PP | R1 | R2 | R3 |
|---|---|---|---|---|---|---|---|
| Standard | 0.8226 | 0.8248 | 0.8270 | 0.8292 | 0.8314 | 0.8336 | 0.8358 |
| Camarilla | 0.8281 | 0.8285 | 0.8289 | 0.8293 | 0.8297 | 0.8301 | 0.8305 |
| Woodie | 0.8227 | 0.8248 | 0.8271 | 0.8292 | 0.8315 | 0.8336 | 0.8359 |
| Fibonacci | 0.8248 | 0.8265 | 0.8275 | 0.8292 | 0.8309 | 0.8319 | 0.8336 |
| Pivot points | S3 | S2 | S1 | PP | R1 | R2 | R3 |
|---|---|---|---|---|---|---|---|
| Standard | 0.8047 | 0.8154 | 0.8230 | 0.8337 | 0.8413 | 0.8520 | 0.8596 |
| Camarilla | 0.8257 | 0.8274 | 0.8290 | 0.8307 | 0.8324 | 0.8341 | 0.8357 |
| Woodie | 0.8033 | 0.8146 | 0.8216 | 0.8329 | 0.8399 | 0.8512 | 0.8582 |
| Fibonacci | 0.8154 | 0.8224 | 0.8267 | 0.8337 | 0.8407 | 0.8450 | 0.8520 |
Numerical data
The following is the status of the technical indicators and moving averages at the time of publication of this technical analysis:
| RSI (14): | 38.76 | |
| MACD (12,26,9): | -0.0017 | |
| Directional Movement: | -12.9146 | |
| AROON (14): | -21.4286 | |
| DEMA (21): | 0.8291 | |
| Parabolic SAR (0,02-0,02-0,2): | 0.8354 | |
| Elder Ray (13): | -0.0021 | |
| Super Trend (3,10): | 0.8266 | |
| Zig ZAG (10): | 0.8270 | |
| VORTEX (21): | 0.9722 | |
| Stochastique (14,3,5): | 16.70 | |
| TEMA (21): | 0.8286 | |
| Williams %R (14): | -97.94 | |
| Chande Momentum Oscillator (20): | -0.0048 | |
| Repulse (5,40,3): | -0.2644 | |
| ROCnROLL: | 2 | |
| TRIX (15,9): | -0.0207 | |
| Courbe Coppock: | 0.94 |
| MA7: | 0.8290 | |
| MA20: | 0.8317 | |
| MA50: | 0.8337 | |
| MA100: | 0.8396 | |
| MAexp7: | 0.8292 | |
| MAexp20: | 0.8312 | |
| MAexp50: | 0.8340 | |
| MAexp100: | 0.8380 | |
| Price / MA7: | -0.21% | |
| Price / MA20: | -0.53% | |
| Price / MA50: | -0.77% | |
| Price / MA100: | -1.46% | |
| Price / MAexp7: | -0.23% | |
| Price / MAexp20: | -0.47% | |
| Price / MAexp50: | -0.80% | |
| Price / MAexp100: | -1.28% |
News
The latest news and videos published on EUR/GBP at the time of the analysis were as follows:
-
 EUR/GBP Forecast December 6, 2024
-
EUR/GBP Forecast December 3, 2024
-
Technical Outlook on USDJPY, USDCAD, EURGBP
-
Technical Analysis on USDJPY, EURGBP, Oil
-
EUR/GBP Forecast November 5, 2024
About author

Online


Add a comment
Comments
0 comments on the analysis EUR/GBP - Daily