| Open: | - |
| Change: | - |
| Volume: | - |
| Low: | - |
| High: | - |
| High / Low range: | - |
| Type: | Forex |
| Ticker: | EURGBP |
| ISIN: |
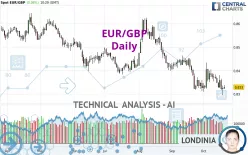
EUR/GBP - Daily - Technical analysis published on 10/21/2024 (GMT)
- 146
- 0
- 10/21/2024 - 10:29
Click here for a new analysis!
- Timeframe : Daily
- - Analysis generated on 10/21/2024 - 10:29
- Status : TARGET REACHED

Summary of the analysis

Additional analysis
Quotes
The EUR/GBP price is 0.8330 GBP. The price registered an increase of +0.06% on the session and was between 0.8321 GBP and 0.8339 GBP. This implies that the price is at +0.11% from its lowest and at -0.11% from its highest.The Central Gaps scanner detects a bearish opening. A small advantage for sellers in the very short term.
Bearish opening
Type : Bearish
Timeframe : Openning
Here is a more detailed summary of the historical variations registered by EUR/GBP:
Near a new LOW record (5 years)
Type : Bearish
Timeframe : Weekly
Near a new LOW record (1 year)
Type : Bearish
Timeframe : Weekly
Near a new HIGH record (1st january)
Type : Bullish
Timeframe : Weekly
Near a new HIGH record (1 month)
Type : Bullish
Timeframe : Weekly
Technical
Technical analysis of this Daily chart of EUR/GBP indicates that the overall trend is strongly bearish. 89.29% of the signals given by moving averages are bearish. This strongly bearish trend is showing signs of slowing down given the slightly bearish signals given by short-term moving averages. There is no crossing of moving average by the price or crossing of moving averages between themselves.
On the 18 technical indicators analysed, 4 are bullish, 4 are neutral and 10 are bearish. But beware of excesses. The Central Indicators scanner currently detects this:
CCI indicator: bullish divergence
Type : Bullish
Timeframe : Daily
MACD indicator: bullish divergence
Type : Bullish
Timeframe : Daily
Price is back over the pivot point
Type : Bullish
Timeframe : Weekly
The analysis of the price chart with Central Patterns scanners does not return any result.
The Central Candlesticks scanner which studies Japanese candlesticks did not detect anything.
| S3 | S2 | S1 | Price | R1 | R2 | R3 | |
|---|---|---|---|---|---|---|---|
| ProTrendLines | 0.7777 | 0.8300 | 0.8323 | 0.8330 | 0.8396 | 0.8515 | 0.8627 |
| Change (%) | -6.64% | -0.36% | -0.08% | - | +0.79% | +2.22% | +3.57% |
| Change | -0.0553 | -0.0030 | -0.0007 | - | +0.0066 | +0.0185 | +0.0297 |
| Level | Intermediate | Major | Major | - | Intermediate | Intermediate | Minor |
Attention could also be paid to pivot points to set price objectives:
| Pivot points | S3 | S2 | S1 | PP | R1 | R2 | R3 |
|---|---|---|---|---|---|---|---|
| Standard | 0.8260 | 0.8278 | 0.8301 | 0.8319 | 0.8342 | 0.8360 | 0.8383 |
| Camarilla | 0.8314 | 0.8318 | 0.8321 | 0.8325 | 0.8329 | 0.8333 | 0.8336 |
| Woodie | 0.8264 | 0.8279 | 0.8305 | 0.8320 | 0.8346 | 0.8361 | 0.8387 |
| Fibonacci | 0.8278 | 0.8293 | 0.8303 | 0.8319 | 0.8334 | 0.8344 | 0.8360 |
| Pivot points | S3 | S2 | S1 | PP | R1 | R2 | R3 |
|---|---|---|---|---|---|---|---|
| Standard | 0.8200 | 0.8248 | 0.8286 | 0.8334 | 0.8372 | 0.8420 | 0.8458 |
| Camarilla | 0.8301 | 0.8309 | 0.8317 | 0.8325 | 0.8333 | 0.8341 | 0.8349 |
| Woodie | 0.8196 | 0.8246 | 0.8282 | 0.8332 | 0.8368 | 0.8418 | 0.8454 |
| Fibonacci | 0.8248 | 0.8281 | 0.8301 | 0.8334 | 0.8367 | 0.8387 | 0.8420 |
| Pivot points | S3 | S2 | S1 | PP | R1 | R2 | R3 |
|---|---|---|---|---|---|---|---|
| Standard | 0.8118 | 0.8215 | 0.8270 | 0.8367 | 0.8422 | 0.8519 | 0.8574 |
| Camarilla | 0.8283 | 0.8297 | 0.8311 | 0.8325 | 0.8339 | 0.8353 | 0.8367 |
| Woodie | 0.8097 | 0.8205 | 0.8249 | 0.8357 | 0.8401 | 0.8509 | 0.8553 |
| Fibonacci | 0.8215 | 0.8273 | 0.8309 | 0.8367 | 0.8425 | 0.8461 | 0.8519 |
Numerical data
The following are the details of the technical indicators and moving averages that were collected to generate this technical analysis:
| RSI (14): | 42.52 | |
| MACD (12,26,9): | -0.0020 | |
| Directional Movement: | -3.0407 | |
| AROON (14): | -78.5714 | |
| DEMA (21): | 0.8331 | |
| Parabolic SAR (0,02-0,02-0,2): | 0.8417 | |
| Elder Ray (13): | -0.0019 | |
| Super Trend (3,10): | 0.8429 | |
| Zig ZAG (10): | 0.8334 | |
| VORTEX (21): | 0.9308 | |
| Stochastique (14,3,5): | 19.50 | |
| TEMA (21): | 0.8332 | |
| Williams %R (14): | -71.94 | |
| Chande Momentum Oscillator (20): | -0.0071 | |
| Repulse (5,40,3): | -0.0389 | |
| ROCnROLL: | 2 | |
| TRIX (15,9): | -0.0352 | |
| Courbe Coppock: | 0.14 |
| MA7: | 0.8341 | |
| MA20: | 0.8351 | |
| MA50: | 0.8413 | |
| MA100: | 0.8439 | |
| MAexp7: | 0.8340 | |
| MAexp20: | 0.8359 | |
| MAexp50: | 0.8397 | |
| MAexp100: | 0.8437 | |
| Price / MA7: | -0.13% | |
| Price / MA20: | -0.25% | |
| Price / MA50: | -0.99% | |
| Price / MA100: | -1.29% | |
| Price / MAexp7: | -0.12% | |
| Price / MAexp20: | -0.35% | |
| Price / MAexp50: | -0.80% | |
| Price / MAexp100: | -1.27% |
News
The latest news and videos published on EUR/GBP at the time of the analysis were as follows:
-
08/19/2024 - 17:01
 EUR/GBP Forecast August 20, 2024
-
07/25/2024 - 11:48
Technical Analysis on USDJPY, GBPUSD, EURGBP
-
07/03/2024 - 18:12
EUR/GBP Forecast July 4, 2024
-
07/01/2024 - 10:12
Weekly Technical Outlook: 01/07/2024 - EURGBP, USDJPY, USDCAD
-
06/27/2024 - 15:55
EUR/GBP Forecast June 28, 2024
About author

Online


Add a comment
Comments
0 comments on the analysis EUR/GBP - Daily