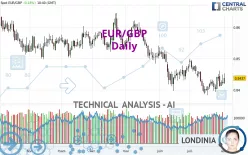
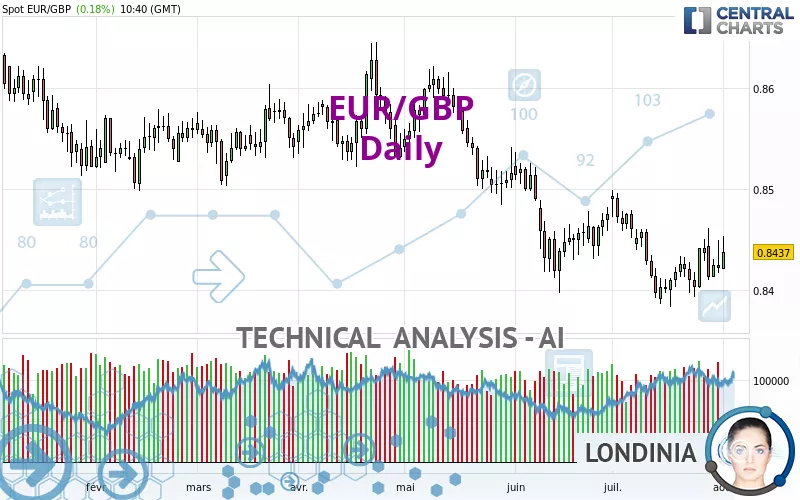
EUR/GBP - Daily - Technical analysis published on 08/01/2024 (GMT)
- 167
- 0
Click here for a new analysis!
- Timeframe : Daily
- - Analysis generated on
- Status : INVALID
Summary of the analysis

Additional analysis
Quotes
The EUR/GBP rating is 0.8438 GBP. On the day, this instrument gained +0.19% and was traded between 0.8421 GBP and 0.8453 GBP over the period. The price is currently at +0.20% from its lowest and -0.18% from its highest.The Central Gaps scanner detects a bearish opening marking the presence of sellers ahead of buyers at the opening but not sufficiently marked to allow the price to register a quotation gap.
Bearish opening
Type : Bearish
Timeframe : Openning
A study of price movements over other periods shows the following variations:
Near a new LOW record (5 years)
Type : Bearish
Timeframe : Weekly
Near a new HIGH record (1 year)
Type : Bullish
Timeframe : Weekly
Near a new HIGH record (1st january)
Type : Bullish
Timeframe : Weekly
Near a new HIGH record (1 month)
Type : Bullish
Timeframe : Weekly
Technical
Technical analysis of EUR/GBP in Daily shows an overall bearish trend. The signals given by moving averages are 75.00% bearish. This bearish trend could slow down given the neutral signals currently being given by short-term moving averages. The Central Indicators market scanner is currently detecting a bullish signal that could impact this trend:
Bullish price crossover with Moving Average 20
Type : Bullish
Timeframe : Daily
The probability of a further increase are moderate given the direction of the technical indicators.
Central Indicators, the scanner specialised in technical indicators, has identified these signals:
RSI indicator is back over 50
Type : Bullish
Timeframe : Daily
Price is back over the pivot point
Type : Bullish
Timeframe : Daily
The Central Patterns scanner, which studies chart patterns, resistances and supports, has identified these signals:
Near horizontal resistance
Type : Bearish
Timeframe : Daily
Resistance of channel is broken
Type : Bullish
Timeframe : Daily
For a small rebound in the very short term, the Central Candlesticks scanner currently notes the presence of this bullish pattern in Japanese candlesticks:
Bullish engulfing lines
Type : Bullish
Timeframe : Daily
| S3 | S2 | S1 | Price | R1 | R2 | R3 | |
|---|---|---|---|---|---|---|---|
| ProTrendLines | 0.7777 | 0.8300 | 0.8397 | 0.8438 | 0.8511 | 0.8563 | 0.8627 |
| Change (%) | -7.83% | -1.64% | -0.49% | - | +0.87% | +1.48% | +2.24% |
| Change | -0.0661 | -0.0138 | -0.0041 | - | +0.0073 | +0.0125 | +0.0189 |
| Level | Intermediate | Major | Major | - | Major | Major | Minor |
Pivot points can also be used to set your price objectives. Here is the price situation in relation to pivot points:
| Pivot points | S3 | S2 | S1 | PP | R1 | R2 | R3 |
|---|---|---|---|---|---|---|---|
| Standard | 0.8378 | 0.8397 | 0.8410 | 0.8429 | 0.8442 | 0.8461 | 0.8474 |
| Camarilla | 0.8413 | 0.8416 | 0.8419 | 0.8422 | 0.8425 | 0.8428 | 0.8431 |
| Woodie | 0.8374 | 0.8396 | 0.8406 | 0.8428 | 0.8438 | 0.8460 | 0.8470 |
| Fibonacci | 0.8397 | 0.8410 | 0.8417 | 0.8429 | 0.8442 | 0.8449 | 0.8461 |
| Pivot points | S3 | S2 | S1 | PP | R1 | R2 | R3 |
|---|---|---|---|---|---|---|---|
| Standard | 0.8346 | 0.8369 | 0.8403 | 0.8426 | 0.8460 | 0.8483 | 0.8517 |
| Camarilla | 0.8420 | 0.8426 | 0.8431 | 0.8436 | 0.8441 | 0.8447 | 0.8452 |
| Woodie | 0.8351 | 0.8372 | 0.8408 | 0.8429 | 0.8465 | 0.8486 | 0.8522 |
| Fibonacci | 0.8369 | 0.8391 | 0.8405 | 0.8426 | 0.8448 | 0.8462 | 0.8483 |
| Pivot points | S3 | S2 | S1 | PP | R1 | R2 | R3 |
|---|---|---|---|---|---|---|---|
| Standard | 0.8254 | 0.8319 | 0.8370 | 0.8435 | 0.8486 | 0.8551 | 0.8602 |
| Camarilla | 0.8390 | 0.8401 | 0.8411 | 0.8422 | 0.8433 | 0.8443 | 0.8454 |
| Woodie | 0.8248 | 0.8316 | 0.8364 | 0.8432 | 0.8480 | 0.8548 | 0.8596 |
| Fibonacci | 0.8319 | 0.8363 | 0.8390 | 0.8435 | 0.8479 | 0.8506 | 0.8551 |
Numerical data
The following is the status of the technical indicators and moving averages at the time of publication of this technical analysis:
| RSI (14): | 51.86 | |
| MACD (12,26,9): | -0.0009 | |
| Directional Movement: | -1.2490 | |
| AROON (14): | 57.1428 | |
| DEMA (21): | 0.8416 | |
| Parabolic SAR (0,02-0,02-0,2): | 0.8399 | |
| Elder Ray (13): | 0.0011 | |
| Super Trend (3,10): | 0.8474 | |
| Zig ZAG (10): | 0.8442 | |
| VORTEX (21): | 0.9322 | |
| Stochastique (14,3,5): | 58.97 | |
| TEMA (21): | 0.8422 | |
| Williams %R (14): | -25.64 | |
| Chande Momentum Oscillator (20): | 0.0040 | |
| Repulse (5,40,3): | 0.0081 | |
| ROCnROLL: | -1 | |
| TRIX (15,9): | -0.0229 | |
| Courbe Coppock: | 0.02 |
| MA7: | 0.8426 | |
| MA20: | 0.8424 | |
| MA50: | 0.8455 | |
| MA100: | 0.8510 | |
| MAexp7: | 0.8427 | |
| MAexp20: | 0.8430 | |
| MAexp50: | 0.8457 | |
| MAexp100: | 0.8493 | |
| Price / MA7: | +0.14% | |
| Price / MA20: | +0.17% | |
| Price / MA50: | -0.20% | |
| Price / MA100: | -0.85% | |
| Price / MAexp7: | +0.13% | |
| Price / MAexp20: | +0.09% | |
| Price / MAexp50: | -0.22% | |
| Price / MAexp100: | -0.65% |
News
Don't forget to follow the news on EUR/GBP. At the time of publication of this analysis, the latest news was as follows:
-
 Technical Analysis on USDJPY, GBPUSD, EURGBP
-
EUR/GBP Forecast July 4, 2024
-
Weekly Technical Outlook: 01/07/2024 - EURGBP, USDJPY, USDCAD
-
EUR/GBP Forecast June 28, 2024
-
EUR/GBP Forecast June 27, 2024
About author

Online


Add a comment
Comments
0 comments on the analysis EUR/GBP - Daily