EUR/GBP
87.37
GBP
(-1.57%)
03/31/2025 - 19:59
Closed Real time data - Forex
| Open: | 86.47 |
| Change: | -1.39 |
| Volume: | 534,270 |
| Low: | 83.90 |
| High: | 87.90 |
| High / Low range: | 4.00 |
| Type: | Forex |
| Ticker: | EURGBP |
| ISIN: |
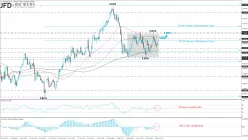
EUR/GBP - in Range Between 0.9015 and 0.8740 - Neutral Bias - 11/24/2017 (GMT)
- 501
- 0
- 11/24/2017 - 08:27
- Who voted?
- Timeframe : Daily

EUR/GBP Chart
Are you looking for opportunities in indices and forex?
DISCOVER LONDINIA OPPORTUNITIES...
DISCOVER LONDINIA OPPORTUNITIES...
The EUR/GBP pair posted a bullish day, adding 0.4% to its performance after the aggressive selling interest from the 0.9015 resistance level. The currency pair is developing within a sideways channel over the last two months with upper boundary the 0.9015 barrier and lower boundary the 0.8740 support obstacle. Currently, in the daily timeframe, the price is holding above the 50-SMA and is approaching the 38.2% Fibonacci retracement level of the last big upward movement with low at 0.8310 and high at 0.9305.From the technical point of view, on the weekly timeframe the indicators, MACD and RSI are struggling near their mid-levels with weak momentum. In addition, returning to the short-term chart, the RSI indicator climbed into the positive territory with weak momentum, whilst the MACD oscillator is flattening on the zero line. The next level to have in mind is the price breaks 0.8940 is the 0.8995 barrier.
This member declared not having a position on this financial instrument or a related financial instrument.
About author

Offline


Add a comment
Comments
0 comments on the analysis EUR/GBP - Daily