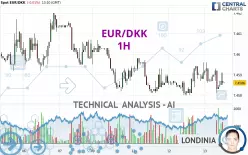
EUR/DKK - 1H - Technical analysis published on 02/13/2025 (GMT)
- 115
- 0
Click here for a new analysis!
- Timeframe : 1H
- - Analysis generated on
- Status : LEVEL MAINTAINED

Summary of the analysis

Additional analysis
Quotes
EUR/DKK rating 7.4586 DKK. The price registered a decrease of -0.01% on the session and was traded between 7.4581 DKK and 7.4596 DKK over the period. The price is currently at +0.01% from its lowest and -0.01% from its highest.A study of price movements over other periods shows the following variations:
Near a new LOW record (5 years)
Type : Bearish
Timeframe : Weekly
Near a new HIGH record (1 year)
Type : Bullish
Timeframe : Weekly
Near a new HIGH record (1st january)
Type : Bullish
Timeframe : Weekly
Near a new HIGH record (1 month)
Type : Bullish
Timeframe : Weekly
Technical
Technical analysis of this 1H chart of EUR/DKK indicates that the overall trend is bearish. The signals given by moving averages are at 75.00% bearish. This bearish trend shows slight signs of slowing down given the slightly bearish signals of short-term moving averages. There is no crossing of moving average by the price or crossing of moving averages between themselves.
In fact, only 7 technical indicators out of 18 studied are currently bearish. Central Indicators, the scanner specialised in technical indicators, has identified these signals:
Price is back over the pivot point
Type : Bullish
Timeframe : 1 hour
Williams %R indicator is back over -50
Type : Bullish
Timeframe : 1 hour
An analysis of the price chart with the Central Patterns scanner (detector of chart patterns and resistances and supports) shows a result that can have an impact on the price change:
Near support of channel
Type : Bullish
Timeframe : 1 hour
There is also a Japanese candlestick pattern detected by Central Candlesticks that could mark the end of the current short-term trend:
Doji
Type : Neutral
Timeframe : 1 hour
| S3 | S2 | S1 | Price | R1 | R2 | R3 | |
|---|---|---|---|---|---|---|---|
| ProTrendLines | 7.4459 | 7.4547 | 7.4579 | 7.4586 | 7.4593 | 7.4615 | 7.4627 |
| Change (%) | -0.17% | -0.05% | -0.01% | - | +0.01% | +0.04% | +0.05% |
| Change | -0.0127 | -0.0039 | -0.0007 | - | +0.0007 | +0.0029 | +0.0041 |
| Level | Intermediate | Intermediate | Intermediate | - | Major | Major | Intermediate |
Pivot points can also be used to set your price objectives. Here is the price situation in relation to pivot points:
| Pivot points | S3 | S2 | S1 | PP | R1 | R2 | R3 |
|---|---|---|---|---|---|---|---|
| Standard | 7.4566 | 7.4573 | 7.4582 | 7.4589 | 7.4598 | 7.4605 | 7.4614 |
| Camarilla | 7.4587 | 7.4588 | 7.4590 | 7.4591 | 7.4593 | 7.4594 | 7.4595 |
| Woodie | 7.4567 | 7.4574 | 7.4583 | 7.4590 | 7.4599 | 7.4606 | 7.4615 |
| Fibonacci | 7.4573 | 7.4579 | 7.4583 | 7.4589 | 7.4595 | 7.4599 | 7.4605 |
| Pivot points | S3 | S2 | S1 | PP | R1 | R2 | R3 |
|---|---|---|---|---|---|---|---|
| Standard | 7.4455 | 7.4523 | 7.4564 | 7.4632 | 7.4673 | 7.4741 | 7.4782 |
| Camarilla | 7.4575 | 7.4585 | 7.4595 | 7.4605 | 7.4615 | 7.4625 | 7.4635 |
| Woodie | 7.4442 | 7.4516 | 7.4551 | 7.4625 | 7.4660 | 7.4734 | 7.4769 |
| Fibonacci | 7.4523 | 7.4565 | 7.4590 | 7.4632 | 7.4674 | 7.4699 | 7.4741 |
| Pivot points | S3 | S2 | S1 | PP | R1 | R2 | R3 |
|---|---|---|---|---|---|---|---|
| Standard | 7.4526 | 7.4550 | 7.4583 | 7.4607 | 7.4640 | 7.4664 | 7.4697 |
| Camarilla | 7.4601 | 7.4607 | 7.4612 | 7.4617 | 7.4622 | 7.4628 | 7.4633 |
| Woodie | 7.4532 | 7.4552 | 7.4589 | 7.4609 | 7.4646 | 7.4666 | 7.4703 |
| Fibonacci | 7.4550 | 7.4571 | 7.4585 | 7.4607 | 7.4628 | 7.4642 | 7.4664 |
Numerical data
The following are the details of the technical indicators and moving averages that were collected to generate this technical analysis:
| RSI (14): | 47.24 | |
| MACD (12,26,9): | 0.0000 | |
| Directional Movement: | 13.7215 | |
| AROON (14): | -64.2857 | |
| DEMA (21): | 7.4587 | |
| Parabolic SAR (0,02-0,02-0,2): | 7.4593 | |
| Elder Ray (13): | 0.0001 | |
| Super Trend (3,10): | 7.4582 | |
| Zig ZAG (10): | 7.4585 | |
| VORTEX (21): | 1.0532 | |
| Stochastique (14,3,5): | 24.44 | |
| TEMA (21): | 7.4587 | |
| Williams %R (14): | -73.33 | |
| Chande Momentum Oscillator (20): | -0.0006 | |
| Repulse (5,40,3): | -0.0085 | |
| ROCnROLL: | 2 | |
| TRIX (15,9): | 0.0001 | |
| Courbe Coppock: | 0.01 |
| MA7: | 7.4596 | |
| MA20: | 7.4608 | |
| MA50: | 7.4598 | |
| MA100: | 7.4592 | |
| MAexp7: | 7.4586 | |
| MAexp20: | 7.4587 | |
| MAexp50: | 7.4588 | |
| MAexp100: | 7.4591 | |
| Price / MA7: | -0.01% | |
| Price / MA20: | -0.03% | |
| Price / MA50: | -0.02% | |
| Price / MA100: | -0.01% | |
| Price / MAexp7: | -0% | |
| Price / MAexp20: | +0.00% | |
| Price / MAexp50: | +0.00% | |
| Price / MAexp100: | -0.01% |
About author
Online


Add a comment
Comments
0 comments on the analysis EUR/DKK - 1H