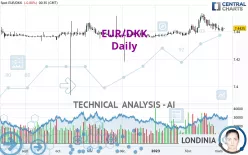
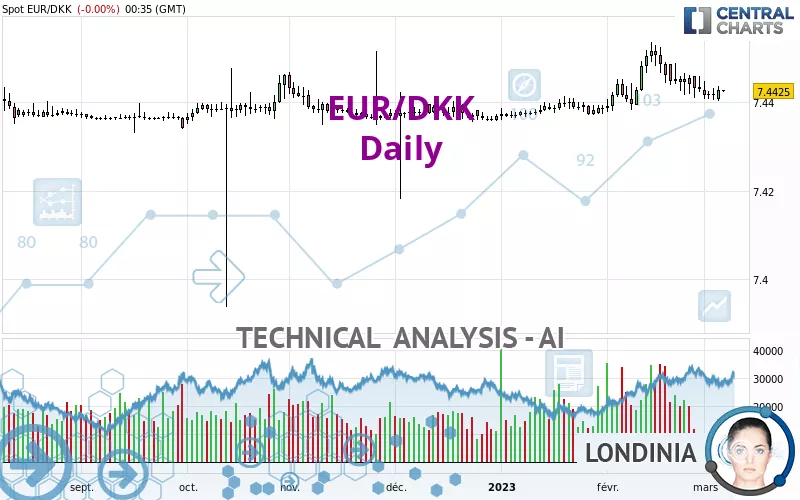
EUR/DKK - Daily - Technical analysis published on 03/07/2023 (GMT)
- 180
- 0
Click here for a new analysis!
- Timeframe : Daily
- - Analysis generated on
- Status : TARGET REACHED
Summary of the analysis

Additional analysis
Quotes
The EUR/DKK rating is 7.4425 DKK. On the day, this instrument gained +0.00% and was between 7.4424 DKK and 7.4429 DKK. This implies that the price is at +0.00% from its lowest and at -0.01% from its highest.So that you have an overall view of the price change, here is a table showing the variations over several periods:
Near a new HIGH record (5 years)
Type : Bullish
Timeframe : Weekly
Near a new HIGH record (1 year)
Type : Bullish
Timeframe : Weekly
Near a new HIGH record (1st january)
Type : Bullish
Timeframe : Weekly
Near a new HIGH record (1 month)
Type : Bullish
Timeframe : Weekly
Technical
A technical analysis in Daily of this EUR/DKK chart shows a bullish trend. 75.00% of the signals given by moving averages are bullish. Caution: the neutral signals currently given by the short-term moving averages indicate that this bullish trend is showing signs of running out of steam. The Central Indicators scanner detects a bullish signal on moving averages that could impact this trend:
Bullish trend reversal : adaptative moving average 50
Type : Bullish
Timeframe : Daily
An assessment of technical indicators does not currently provide any relevant information to suggest whether the signal given by the technical indicators is more bullish or bearish.
Caution: the Central Indicators scanner currently detects an excess:
Williams %R indicator is oversold : under -80
Type : Neutral
Timeframe : Daily
Central Patterns, the scanner specializing in chart patterns, did not identify any signals.
The Central Candlesticks scanner, specialised in Japanese candlesticks, did not identify any signals.
| S3 | S2 | S1 | Price | R1 | R2 | R3 | |
|---|---|---|---|---|---|---|---|
| ProTrendLines | 7.4370 | 7.4386 | 7.4423 | 7.4425 | 7.4441 | 7.4460 | 7.4517 |
| Change (%) | -0.07% | -0.05% | +0.00% | - | +0.02% | +0.05% | +0.12% |
| Change | -0.0055 | -0.0039 | -0.0002 | - | +0.0016 | +0.0035 | +0.0092 |
| Level | Major | Intermediate | Major | - | Minor | Major | Intermediate |
Attention could also be paid to pivot points to set price objectives:
| Pivot points | S3 | S2 | S1 | PP | R1 | R2 | R3 |
|---|---|---|---|---|---|---|---|
| Standard | 7.4373 | 7.4388 | 7.4408 | 7.4423 | 7.4443 | 7.4458 | 7.4478 |
| Camarilla | 7.4418 | 7.4422 | 7.4425 | 7.4428 | 7.4431 | 7.4434 | 7.4438 |
| Woodie | 7.4376 | 7.4389 | 7.4411 | 7.4424 | 7.4446 | 7.4459 | 7.4481 |
| Fibonacci | 7.4388 | 7.4401 | 7.4410 | 7.4423 | 7.4436 | 7.4445 | 7.4458 |
| Pivot points | S3 | S2 | S1 | PP | R1 | R2 | R3 |
|---|---|---|---|---|---|---|---|
| Standard | 7.4341 | 7.4373 | 7.4395 | 7.4427 | 7.4449 | 7.4481 | 7.4503 |
| Camarilla | 7.4401 | 7.4406 | 7.4411 | 7.4416 | 7.4421 | 7.4426 | 7.4431 |
| Woodie | 7.4335 | 7.4371 | 7.4389 | 7.4425 | 7.4443 | 7.4479 | 7.4497 |
| Fibonacci | 7.4373 | 7.4394 | 7.4407 | 7.4427 | 7.4448 | 7.4461 | 7.4481 |
| Pivot points | S3 | S2 | S1 | PP | R1 | R2 | R3 |
|---|---|---|---|---|---|---|---|
| Standard | 7.4202 | 7.4291 | 7.4360 | 7.4449 | 7.4518 | 7.4607 | 7.4676 |
| Camarilla | 7.4387 | 7.4401 | 7.4416 | 7.4430 | 7.4445 | 7.4459 | 7.4474 |
| Woodie | 7.4193 | 7.4286 | 7.4351 | 7.4444 | 7.4509 | 7.4602 | 7.4667 |
| Fibonacci | 7.4291 | 7.4351 | 7.4388 | 7.4449 | 7.4509 | 7.4546 | 7.4607 |
Numerical data
The following is the status of the technical indicators and moving averages at the time of publication of this technical analysis:
| RSI (14): | 48.14 | |
| MACD (12,26,9): | 0.0001 | |
| Directional Movement: | -0.7830 | |
| AROON (14): | -92.8571 | |
| DEMA (21): | 7.4439 | |
| Parabolic SAR (0,02-0,02-0,2): | 7.4477 | |
| Elder Ray (13): | -0.0006 | |
| Super Trend (3,10): | 7.4400 | |
| Zig ZAG (10): | 7.4426 | |
| VORTEX (21): | 1.0146 | |
| Stochastique (14,3,5): | 15.34 | |
| TEMA (21): | 7.4429 | |
| Williams %R (14): | -81.97 | |
| Chande Momentum Oscillator (20): | -0.0037 | |
| Repulse (5,40,3): | 0.0003 | |
| ROCnROLL: | -1 | |
| TRIX (15,9): | 0.0018 | |
| Courbe Coppock: | 0.13 |
| MA7: | 7.4424 | |
| MA20: | 7.4450 | |
| MA50: | 7.4412 | |
| MA100: | 7.4399 | |
| MAexp7: | 7.4428 | |
| MAexp20: | 7.4434 | |
| MAexp50: | 7.4420 | |
| MAexp100: | 7.4406 | |
| Price / MA7: | +0.00% | |
| Price / MA20: | -0.03% | |
| Price / MA50: | +0.02% | |
| Price / MA100: | +0.03% | |
| Price / MAexp7: | +0.00% | |
| Price / MAexp20: | -0.01% | |
| Price / MAexp50: | +0.01% | |
| Price / MAexp100: | +0.03% |
About author
Online


Add a comment
Comments
0 comments on the analysis EUR/DKK - Daily