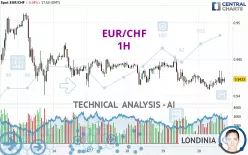
EUR/CHF - 1H - Technical analysis published on 02/20/2025 (GMT)
- 185
- 0
Click here for a new analysis!
- Timeframe : 1H
- - Analysis generated on
- Status : TARGET REACHED

Summary of the analysis

Additional analysis
Quotes
EUR/CHF rating 0.9423 CHF. On the day, this instrument lost -0.04% with the lowest point at 0.9408 CHF and the highest point at 0.9435 CHF. The deviation from the price is +0.16% for the low point and -0.13% for the high point.So that you have an overall view of the price change, here is a table showing the variations over several periods:
Near a new LOW record (5 years)
Type : Bearish
Timeframe : Weekly
Near a new LOW record (1 year)
Type : Bearish
Timeframe : Weekly
Near a new HIGH record (1st january)
Type : Bullish
Timeframe : Weekly
Near a new HIGH record (1 month)
Type : Bullish
Timeframe : Weekly
Technical
Technical analysis of EUR/CHF in 1H shows an overall bearish trend. The signals given by moving averages are 75.00% bearish. This bearish trend could slow down given the neutral signals currently being given by short-term moving averages. The Central Indicators market scanner currently does not detect any result that concerns moving averages.
In fact, according to the parameters integrated into the Central Analyzer system, only 9 technical indicators out of 18 analysed are currently bullish. The Central Indicators scanner found this result concerning these indicators:
RSI indicator is back over 50
Type : Bullish
Timeframe : 1 hour
The Central Patterns scanner, which studies chart patterns, resistances and supports, has identified this signal:
Near support of triangle
Type : Bullish
Timeframe : 1 hour
The Central Candlesticks scanner, specialised in Japanese candlesticks, did not identify any signals.
| S3 | S2 | S1 | Price | R1 | R2 | R3 | |
|---|---|---|---|---|---|---|---|
| ProTrendLines | 0.9372 | 0.9401 | 0.9413 | 0.9423 | 0.9426 | 0.9455 | 0.9473 |
| Change (%) | -0.54% | -0.23% | -0.11% | - | +0.03% | +0.34% | +0.53% |
| Change | -0.0051 | -0.0022 | -0.0010 | - | +0.0003 | +0.0032 | +0.0050 |
| Level | Intermediate | Minor | Major | - | Intermediate | Intermediate | Minor |
To determine price objectives, it is also possible to use the pivot points. Here is the price position in relation to pivot points:
| Pivot points | S3 | S2 | S1 | PP | R1 | R2 | R3 |
|---|---|---|---|---|---|---|---|
| Standard | 0.9366 | 0.9390 | 0.9408 | 0.9432 | 0.9450 | 0.9474 | 0.9492 |
| Camarilla | 0.9416 | 0.9419 | 0.9423 | 0.9427 | 0.9431 | 0.9435 | 0.9439 |
| Woodie | 0.9364 | 0.9389 | 0.9406 | 0.9431 | 0.9448 | 0.9473 | 0.9490 |
| Fibonacci | 0.9390 | 0.9406 | 0.9416 | 0.9432 | 0.9448 | 0.9458 | 0.9474 |
| Pivot points | S3 | S2 | S1 | PP | R1 | R2 | R3 |
|---|---|---|---|---|---|---|---|
| Standard | 0.9203 | 0.9280 | 0.9359 | 0.9436 | 0.9515 | 0.9592 | 0.9671 |
| Camarilla | 0.9395 | 0.9409 | 0.9424 | 0.9438 | 0.9452 | 0.9467 | 0.9481 |
| Woodie | 0.9204 | 0.9281 | 0.9360 | 0.9437 | 0.9516 | 0.9593 | 0.9672 |
| Fibonacci | 0.9280 | 0.9340 | 0.9376 | 0.9436 | 0.9496 | 0.9532 | 0.9592 |
| Pivot points | S3 | S2 | S1 | PP | R1 | R2 | R3 |
|---|---|---|---|---|---|---|---|
| Standard | 0.9155 | 0.9243 | 0.9343 | 0.9431 | 0.9531 | 0.9619 | 0.9719 |
| Camarilla | 0.9392 | 0.9410 | 0.9427 | 0.9444 | 0.9461 | 0.9479 | 0.9496 |
| Woodie | 0.9162 | 0.9246 | 0.9350 | 0.9434 | 0.9538 | 0.9622 | 0.9726 |
| Fibonacci | 0.9243 | 0.9315 | 0.9359 | 0.9431 | 0.9503 | 0.9547 | 0.9619 |
Numerical data
The following are the details of the technical indicators and moving averages that were collected to generate this technical analysis:
| RSI (14): | 50.33 | |
| MACD (12,26,9): | -0.0001 | |
| Directional Movement: | 3.4659 | |
| AROON (14): | 50.0000 | |
| DEMA (21): | 0.9418 | |
| Parabolic SAR (0,02-0,02-0,2): | 0.9414 | |
| Elder Ray (13): | 0.0002 | |
| Super Trend (3,10): | 0.9434 | |
| Zig ZAG (10): | 0.9422 | |
| VORTEX (21): | 0.9883 | |
| Stochastique (14,3,5): | 50.62 | |
| TEMA (21): | 0.9419 | |
| Williams %R (14): | -48.15 | |
| Chande Momentum Oscillator (20): | 0.0011 | |
| Repulse (5,40,3): | -0.0021 | |
| ROCnROLL: | -1 | |
| TRIX (15,9): | -0.0044 | |
| Courbe Coppock: | 0.02 |
| MA7: | 0.9445 | |
| MA20: | 0.9434 | |
| MA50: | 0.9403 | |
| MA100: | 0.9381 | |
| MAexp7: | 0.9421 | |
| MAexp20: | 0.9421 | |
| MAexp50: | 0.9426 | |
| MAexp100: | 0.9430 | |
| Price / MA7: | -0.23% | |
| Price / MA20: | -0.12% | |
| Price / MA50: | +0.21% | |
| Price / MA100: | +0.45% | |
| Price / MAexp7: | +0.02% | |
| Price / MAexp20: | +0.02% | |
| Price / MAexp50: | -0.03% | |
| Price / MAexp100: | -0.07% |
News
Don't forget to follow the news on EUR/CHF. At the time of publication of this analysis, the latest news was as follows:
-
 EUR/CHF Analysis: The Grind Continues
-
EUR/CHF Analysis: The Euro Gives Up Gains Against the Franc
-
EUR/CHF Analysis: Will the Franc Continue to Weaken
-
EUR/CHF Outlook - Are We About to See a Run Higher?
-
EUR/CHF Forecast November 28, 2024
About author
Online


Add a comment
Comments
0 comments on the analysis EUR/CHF - 1H