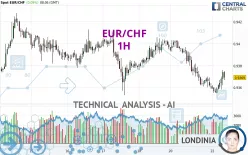
EUR/CHF - 1H - Technical analysis published on 10/22/2024 (GMT)
- 135
- 0
Click here for a new analysis!
- Timeframe : 1H
- - Analysis generated on
- Status : TARGET REACHED

Summary of the analysis

Additional analysis
Quotes
EUR/CHF rating 0.9369 CHF. On the day, this instrument gained +0.09% and was traded between 0.9355 CHF and 0.9376 CHF over the period. The price is currently at +0.15% from its lowest and -0.07% from its highest.So that you have an overall view of the price change, here is a table showing the variations over several periods:
Near a new LOW record (5 years)
Type : Bearish
Timeframe : Weekly
Near a new LOW record (1 year)
Type : Bearish
Timeframe : Weekly
Near a new LOW record (1st january)
Type : Bearish
Timeframe : Weekly
Near a new HIGH record (1 month)
Type : Bullish
Timeframe : Weekly
Technical
Technical analysis of EUR/CHF in 1H shows an overall bearish trend. 75.00% of the signals given by moving averages are bearish. Caution: as the signals currently given by short-term moving averages are rather neutral, the bearish trend could slow down. There is no crossing of moving average by the price or crossing of moving averages between themselves.
The probability of a further increase are moderate given the direction of the technical indicators.
Central Indicators, the detector scanner for these technical indicators has recently detected several signals:
RSI indicator is back under 50
Type : Bearish
Timeframe : 1 hour
Price is back under the pivot point
Type : Bearish
Timeframe : Weekly
No signals are given by Central Patterns, a market scanner specialised in chart patterns, resistances and supports.
The Central Candlesticks scanner, specialised in Japanese candlesticks, did not identify any signals.
| S3 | S2 | S1 | Price | R1 | R2 | R3 | |
|---|---|---|---|---|---|---|---|
| ProTrendLines | 0.9344 | 0.9353 | 0.9364 | 0.9369 | 0.9378 | 0.9406 | 0.9428 |
| Change (%) | -0.27% | -0.17% | -0.05% | - | +0.10% | +0.39% | +0.63% |
| Change | -0.0025 | -0.0016 | -0.0005 | - | +0.0009 | +0.0037 | +0.0059 |
| Level | Minor | Intermediate | Major | - | Intermediate | Intermediate | Intermediate |
Attention could also be paid to pivot points to set price objectives:
| Pivot points | S3 | S2 | S1 | PP | R1 | R2 | R3 |
|---|---|---|---|---|---|---|---|
| Standard | 0.9302 | 0.9330 | 0.9346 | 0.9374 | 0.9390 | 0.9418 | 0.9434 |
| Camarilla | 0.9349 | 0.9353 | 0.9357 | 0.9361 | 0.9365 | 0.9369 | 0.9373 |
| Woodie | 0.9295 | 0.9327 | 0.9339 | 0.9371 | 0.9383 | 0.9415 | 0.9427 |
| Fibonacci | 0.9330 | 0.9347 | 0.9358 | 0.9374 | 0.9391 | 0.9402 | 0.9418 |
| Pivot points | S3 | S2 | S1 | PP | R1 | R2 | R3 |
|---|---|---|---|---|---|---|---|
| Standard | 0.9282 | 0.9318 | 0.9357 | 0.9393 | 0.9432 | 0.9468 | 0.9507 |
| Camarilla | 0.9376 | 0.9383 | 0.9390 | 0.9397 | 0.9404 | 0.9411 | 0.9418 |
| Woodie | 0.9285 | 0.9319 | 0.9360 | 0.9394 | 0.9435 | 0.9469 | 0.9510 |
| Fibonacci | 0.9318 | 0.9346 | 0.9364 | 0.9393 | 0.9421 | 0.9439 | 0.9468 |
| Pivot points | S3 | S2 | S1 | PP | R1 | R2 | R3 |
|---|---|---|---|---|---|---|---|
| Standard | 0.9111 | 0.9209 | 0.9312 | 0.9410 | 0.9513 | 0.9611 | 0.9714 |
| Camarilla | 0.9360 | 0.9378 | 0.9397 | 0.9415 | 0.9433 | 0.9452 | 0.9470 |
| Woodie | 0.9114 | 0.9210 | 0.9315 | 0.9411 | 0.9516 | 0.9612 | 0.9717 |
| Fibonacci | 0.9209 | 0.9286 | 0.9333 | 0.9410 | 0.9487 | 0.9534 | 0.9611 |
Numerical data
The following are the details of the technical indicators and moving averages that were collected to generate this technical analysis:
| RSI (14): | 48.21 | |
| MACD (12,26,9): | -0.0004 | |
| Directional Movement: | 3.2212 | |
| AROON (14): | 42.8571 | |
| DEMA (21): | 0.9362 | |
| Parabolic SAR (0,02-0,02-0,2): | 0.9358 | |
| Elder Ray (13): | 0.0005 | |
| Super Trend (3,10): | 0.9376 | |
| Zig ZAG (10): | 0.9369 | |
| VORTEX (21): | 0.9735 | |
| Stochastique (14,3,5): | 79.68 | |
| TEMA (21): | 0.9362 | |
| Williams %R (14): | -33.33 | |
| Chande Momentum Oscillator (20): | 0.0000 | |
| Repulse (5,40,3): | 0.0693 | |
| ROCnROLL: | -1 | |
| TRIX (15,9): | -0.0102 | |
| Courbe Coppock: | 0.06 |
| MA7: | 0.9386 | |
| MA20: | 0.9397 | |
| MA50: | 0.9419 | |
| MA100: | 0.9510 | |
| MAexp7: | 0.9366 | |
| MAexp20: | 0.9368 | |
| MAexp50: | 0.9376 | |
| MAexp100: | 0.9383 | |
| Price / MA7: | -0.18% | |
| Price / MA20: | -0.30% | |
| Price / MA50: | -0.53% | |
| Price / MA100: | -1.48% | |
| Price / MAexp7: | +0.03% | |
| Price / MAexp20: | +0.01% | |
| Price / MAexp50: | -0.07% | |
| Price / MAexp100: | -0.15% |
News
The last news published on EUR/CHF at the time of the generation of this analysis was as follows:
-
 EUR/CHF Forecast October 9, 2024
-
EUR/CHF Forecast October 7, 2024
-
EUR/CHF Forecast September 23, 2024
-
EUR/CHF Forecast September 18, 2024
-
EUR/CHF Forecast September 11, 2024
About author

Online


Add a comment
Comments
0 comments on the analysis EUR/CHF - 1H