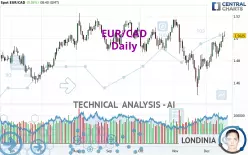
EUR/CAD - Daily - Technical analysis published on 12/18/2024 (GMT)
- 115
- 0
Click here for a new analysis!
- Timeframe : Daily
- - Analysis generated on
- Status : INVALID

Summary of the analysis

Additional analysis
Quotes
The EUR/CAD price is 1.5026 CAD. The price has increased by +0.05% since the last closing with the lowest point at 1.5017 CAD and the highest point at 1.5060 CAD. The deviation from the price is +0.06% for the low point and -0.23% for the high point.Here is a more detailed summary of the historical variations registered by EUR/CAD:
Near a new LOW record (1 year)
Type : Bearish
Timeframe : Weekly
Near a new LOW record (1st january)
Type : Bearish
Timeframe : Weekly
New HIGH record (1 month)
Type : Bullish
Timeframe : Weekly
Technical
A technical analysis in Daily of this EUR/CAD chart shows a bullish trend. 71.43% of the signals given by moving averages are bullish. The overall trend is reinforced by the strong bullish signals from short-term moving averages. The Central Indicators market scanner is currently detecting a bullish signal that could impact this trend:
Bullish trend reversal : Moving Average 100
Type : Bullish
Timeframe : Daily
Technical indicators are strongly bullish, suggesting that the price increase should continue.
Caution: the Central Indicators scanner currently detects an excess:
CCI indicator: bearish divergence
Type : Bearish
Timeframe : Daily
Pivot points : price is over resistance 1
Type : Neutral
Timeframe : Weekly
An analysis of the price chart with the Central Patterns scanner (detector of chart patterns and resistances and supports) shows several results that can have an impact on the price change:
Near horizontal resistance
Type : Bearish
Timeframe : Daily
Resistance of channel is broken
Type : Bullish
Timeframe : Daily
Central Candlesticks, the scanner specialised in Japanese candlesticks, detects this inversion signal that could impact the current short-term trend:
White gravestone / inverted hammer
Type : Neutral
Timeframe : Daily
| S3 | S2 | S1 | Price | R1 | R2 | R3 | |
|---|---|---|---|---|---|---|---|
| ProTrendLines | 1.4625 | 1.4743 | 1.4890 | 1.5026 | 1.5074 | 1.5151 | 1.5909 |
| Change (%) | -2.67% | -1.88% | -0.91% | - | +0.32% | +0.83% | +5.88% |
| Change | -0.0401 | -0.0283 | -0.0136 | - | +0.0048 | +0.0125 | +0.0883 |
| Level | Major | Minor | Major | - | Major | Major | Major |
Attention could also be paid to pivot points to set price objectives:
| Pivot points | S3 | S2 | S1 | PP | R1 | R2 | R3 |
|---|---|---|---|---|---|---|---|
| Standard | 1.4888 | 1.4927 | 1.4972 | 1.5011 | 1.5056 | 1.5095 | 1.5140 |
| Camarilla | 1.4995 | 1.5003 | 1.5010 | 1.5018 | 1.5026 | 1.5033 | 1.5041 |
| Woodie | 1.4892 | 1.4929 | 1.4976 | 1.5013 | 1.5060 | 1.5097 | 1.5144 |
| Fibonacci | 1.4927 | 1.4959 | 1.4979 | 1.5011 | 1.5043 | 1.5063 | 1.5095 |
| Pivot points | S3 | S2 | S1 | PP | R1 | R2 | R3 |
|---|---|---|---|---|---|---|---|
| Standard | 1.4702 | 1.4761 | 1.4856 | 1.4915 | 1.5010 | 1.5069 | 1.5164 |
| Camarilla | 1.4908 | 1.4922 | 1.4936 | 1.4950 | 1.4964 | 1.4978 | 1.4992 |
| Woodie | 1.4719 | 1.4770 | 1.4873 | 1.4924 | 1.5027 | 1.5078 | 1.5181 |
| Fibonacci | 1.4761 | 1.4820 | 1.4857 | 1.4915 | 1.4974 | 1.5011 | 1.5069 |
| Pivot points | S3 | S2 | S1 | PP | R1 | R2 | R3 |
|---|---|---|---|---|---|---|---|
| Standard | 1.3793 | 1.4141 | 1.4476 | 1.4824 | 1.5159 | 1.5507 | 1.5842 |
| Camarilla | 1.4624 | 1.4687 | 1.4749 | 1.4812 | 1.4875 | 1.4937 | 1.5000 |
| Woodie | 1.3788 | 1.4138 | 1.4471 | 1.4821 | 1.5154 | 1.5504 | 1.5837 |
| Fibonacci | 1.4141 | 1.4402 | 1.4563 | 1.4824 | 1.5085 | 1.5246 | 1.5507 |
Numerical data
The following are the details of the technical indicators and moving averages that were collected to generate this technical analysis:
| RSI (14): | 61.65 | |
| MACD (12,26,9): | 0.0032 | |
| Directional Movement: | 7.7186 | |
| AROON (14): | 78.5714 | |
| DEMA (21): | 1.4925 | |
| Parabolic SAR (0,02-0,02-0,2): | 1.4818 | |
| Elder Ray (13): | 0.0118 | |
| Super Trend (3,10): | 1.4777 | |
| Zig ZAG (10): | 1.5027 | |
| VORTEX (21): | 1.0992 | |
| Stochastique (14,3,5): | 92.87 | |
| TEMA (21): | 1.4982 | |
| Williams %R (14): | -9.50 | |
| Chande Momentum Oscillator (20): | 0.0279 | |
| Repulse (5,40,3): | 0.5635 | |
| ROCnROLL: | 1 | |
| TRIX (15,9): | 0.0003 | |
| Courbe Coppock: | 2.86 |
| MA7: | 1.4950 | |
| MA20: | 1.4841 | |
| MA50: | 1.4913 | |
| MA100: | 1.4973 | |
| MAexp7: | 1.4963 | |
| MAexp20: | 1.4900 | |
| MAexp50: | 1.4906 | |
| MAexp100: | 1.4912 | |
| Price / MA7: | +0.51% | |
| Price / MA20: | +1.25% | |
| Price / MA50: | +0.76% | |
| Price / MA100: | +0.35% | |
| Price / MAexp7: | +0.42% | |
| Price / MAexp20: | +0.85% | |
| Price / MAexp50: | +0.81% | |
| Price / MAexp100: | +0.76% |
News
Don't forget to follow the news on EUR/CAD. At the time of publication of this analysis, the latest news was as follows:
-
 EUR/CAD Forecast August 22, 2024
-
EUR/CAD Forecast August 5, 2024
-
EUR/CAD Forecast July 11, 2024
-
EUR/CAD Forecast June 4, 2024
-
Forex Analysis: EUR/USD, GBP/USD, EUR/CAD - Amana Capital
About author

Online


Add a comment
Comments
0 comments on the analysis EUR/CAD - Daily