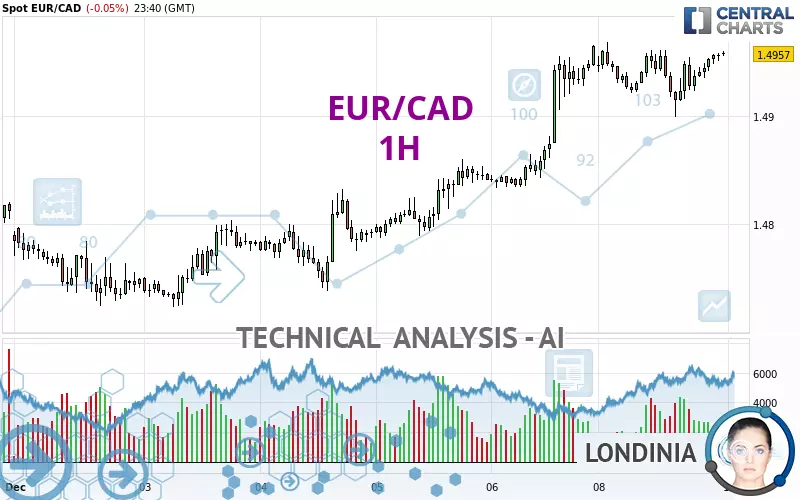
EUR/CAD - 1H - Technical analysis published on 12/09/2024 (GMT)
- 131
- 0
Click here for a new analysis!
- Timeframe : 1H
- - Analysis generated on
- Status : INVALID

Summary of the analysis

Additional analysis
Quotes
The EUR/CAD price is 1.4957 CAD. On the day, this instrument lost -0.05% and was between 1.4899 CAD and 1.4968 CAD. This implies that the price is at +0.39% from its lowest and at -0.07% from its highest.The Central Gaps scanner detects a bearish opening marking the presence of sellers ahead of buyers at the opening but not sufficiently marked to allow the price to register a quotation gap.
Bearish opening
Type : Bearish
Timeframe : Openning
A study of price movements over other periods shows the following variations:
Near a new LOW record (1 year)
Type : Bearish
Timeframe : Weekly
Near a new LOW record (1st january)
Type : Bearish
Timeframe : Weekly
Near a new LOW record (1 month)
Type : Bearish
Timeframe : Weekly
Technical
Technical analysis of EUR/CAD in 1H shows a strongly overall bullish trend. 92.86% of the signals given by moving averages are bullish. The overall trend is supported by the strong bullish signals from short-term moving averages. There is no crossing of moving average by the price or crossing of moving averages between themselves.
An assessment of technical indicators shows a strong bullish signal.
But beware of excesses. The Central Indicators scanner currently detects this:
CCI indicator is overbought : over 100
Type : Neutral
Timeframe : 1 hour
Williams %R indicator is overbought : over -20
Type : Neutral
Timeframe : 1 hour
The analysis of the price chart with Central Patterns scanners does not return any result.
There is also a Japanese candlestick pattern detected by Central Candlesticks that could mark the end of the current short-term trend:
Doji
Type : Neutral
Timeframe : 1 hour
| S3 | S2 | S1 | Price | R1 | R2 | R3 | |
|---|---|---|---|---|---|---|---|
| ProTrendLines | 1.4860 | 1.4890 | 1.4955 | 1.4957 | 1.5074 | 1.5151 | 1.5909 |
| Change (%) | -0.65% | -0.45% | -0.01% | - | +0.78% | +1.30% | +6.36% |
| Change | -0.0097 | -0.0067 | -0.0002 | - | +0.0117 | +0.0194 | +0.0952 |
| Level | Intermediate | Major | Minor | - | Major | Major | Major |
To determine price objectives, it is also possible to use the pivot points. Here is the price position in relation to pivot points:
| Pivot points | S3 | S2 | S1 | PP | R1 | R2 | R3 |
|---|---|---|---|---|---|---|---|
| Standard | 1.4744 | 1.4789 | 1.4876 | 1.4921 | 1.5008 | 1.5053 | 1.5140 |
| Camarilla | 1.4928 | 1.4940 | 1.4952 | 1.4964 | 1.4976 | 1.4988 | 1.5000 |
| Woodie | 1.4766 | 1.4800 | 1.4898 | 1.4932 | 1.5030 | 1.5064 | 1.5162 |
| Fibonacci | 1.4789 | 1.4839 | 1.4870 | 1.4921 | 1.4971 | 1.5002 | 1.5053 |
| Pivot points | S3 | S2 | S1 | PP | R1 | R2 | R3 |
|---|---|---|---|---|---|---|---|
| Standard | 1.4561 | 1.4642 | 1.4803 | 1.4884 | 1.5045 | 1.5126 | 1.5287 |
| Camarilla | 1.4898 | 1.4920 | 1.4942 | 1.4964 | 1.4986 | 1.5008 | 1.5031 |
| Woodie | 1.4601 | 1.4662 | 1.4843 | 1.4904 | 1.5085 | 1.5146 | 1.5327 |
| Fibonacci | 1.4642 | 1.4734 | 1.4792 | 1.4884 | 1.4976 | 1.5034 | 1.5126 |
| Pivot points | S3 | S2 | S1 | PP | R1 | R2 | R3 |
|---|---|---|---|---|---|---|---|
| Standard | 1.3793 | 1.4141 | 1.4476 | 1.4824 | 1.5159 | 1.5507 | 1.5842 |
| Camarilla | 1.4624 | 1.4687 | 1.4749 | 1.4812 | 1.4875 | 1.4937 | 1.5000 |
| Woodie | 1.3788 | 1.4138 | 1.4471 | 1.4821 | 1.5154 | 1.5504 | 1.5837 |
| Fibonacci | 1.4141 | 1.4402 | 1.4563 | 1.4824 | 1.5085 | 1.5246 | 1.5507 |
Numerical data
The following are the details of the technical indicators and moving averages that were collected to generate this technical analysis:
| RSI (14): | 59.66 | |
| MACD (12,26,9): | 0.0009 | |
| Directional Movement: | 11.5374 | |
| AROON (14): | -21.4285 | |
| DEMA (21): | 1.4954 | |
| Parabolic SAR (0,02-0,02-0,2): | 1.4909 | |
| Elder Ray (13): | 0.0013 | |
| Super Trend (3,10): | 1.4910 | |
| Zig ZAG (10): | 1.4959 | |
| VORTEX (21): | 1.0696 | |
| Stochastique (14,3,5): | 93.55 | |
| TEMA (21): | 1.4949 | |
| Williams %R (14): | -4.84 | |
| Chande Momentum Oscillator (20): | 0.0021 | |
| Repulse (5,40,3): | 0.0757 | |
| ROCnROLL: | 1 | |
| TRIX (15,9): | 0.0081 | |
| Courbe Coppock: | 0.12 |
| MA7: | 1.4842 | |
| MA20: | 1.4790 | |
| MA50: | 1.4913 | |
| MA100: | 1.4976 | |
| MAexp7: | 1.4950 | |
| MAexp20: | 1.4941 | |
| MAexp50: | 1.4914 | |
| MAexp100: | 1.4875 | |
| Price / MA7: | +0.77% | |
| Price / MA20: | +1.13% | |
| Price / MA50: | +0.30% | |
| Price / MA100: | -0.13% | |
| Price / MAexp7: | +0.05% | |
| Price / MAexp20: | +0.11% | |
| Price / MAexp50: | +0.29% | |
| Price / MAexp100: | +0.55% |
News
Don't forget to follow the news on EUR/CAD. At the time of publication of this analysis, the latest news was as follows:
-
 EUR/CAD Forecast August 22, 2024
-
EUR/CAD Forecast August 5, 2024
-
EUR/CAD Forecast July 11, 2024
-
EUR/CAD Forecast June 4, 2024
-
Forex Analysis: EUR/USD, GBP/USD, EUR/CAD - Amana Capital
About author
Online


Add a comment
Comments
0 comments on the analysis EUR/CAD - 1H