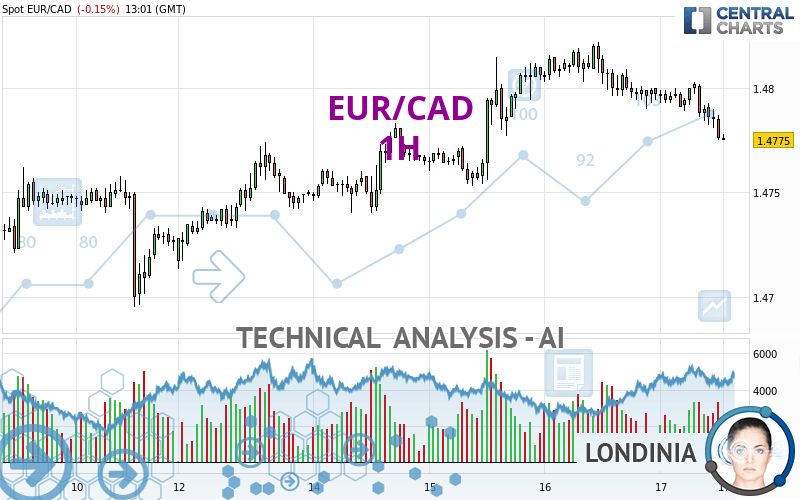
EUR/CAD - 1H - Technical analysis published on 05/17/2024 (GMT)
- 55
- 0
Click here for a new analysis!
- Timeframe : 1H
- - Analysis generated on
- Status : INVALID

Summary of the analysis

Additional analysis
Quotes
The EUR/CAD price is 1.4775 CAD. On the day, this instrument lost -0.15% with the lowest point at 1.4775 CAD and the highest point at 1.4803 CAD. The deviation from the price is 0% for the low point and -0.19% for the high point.A bearish opening was detected by the Central Gaps scanner. Sellers are trying to impose a bearish trend in the very short term.
Bearish opening
Type : Bearish
Timeframe : Openning
So that you have an overall view of the price change, here is a table showing the variations over several periods:
Near a new LOW record (1 year)
Type : Bearish
Timeframe : Weekly
Near a new LOW record (1st january)
Type : Bearish
Timeframe : Weekly
Near a new LOW record (1 month)
Type : Bearish
Timeframe : Weekly
Technical
Technical analysis of EUR/CAD in 1H shows an overall slightly bearish trend. Only 57.14% of the signals given by moving averages are bearish. This slightly bearish trend is reinforced by the strong signals currently being given by short-term moving averages. The Central Indicators market scanner is currently detecting a bearish signal that could impact this trend:
Bearish price crossover with adaptative moving average 100
Type : Bearish
Timeframe : 1 hour
In fact, 12 technical indicators on 18 studied are currently positioned bearish. Caution: the Central Indicators scanner currently detects an excess:
CCI indicator is oversold : under -100
Type : Neutral
Timeframe : 1 hour
Williams %R indicator is oversold : under -80
Type : Neutral
Timeframe : 1 hour
Pivot points : price is over resistance 1
Type : Neutral
Timeframe : Weekly
Pivot points : price is under support 1
Type : Neutral
Timeframe : 1 hour
Ichimoku : price is under the cloud
Type : Bearish
Timeframe : 1 hour
Central Patterns, the market scanner focusing on chart patterns, resistances and supports found these results:
Near horizontal support
Type : Bullish
Timeframe : 1 hour
Support of channel is broken
Type : Bearish
Timeframe : 1 hour
The Central Candlesticks scanner which studies Japanese candlesticks did not detect anything.
| S3 | S2 | S1 | Price | R1 | R2 | R3 | |
|---|---|---|---|---|---|---|---|
| ProTrendLines | 1.4740 | 1.4757 | 1.4774 | 1.4775 | 1.4803 | 1.4822 | 1.4908 |
| Change (%) | -0.24% | -0.12% | -0.01% | - | +0.19% | +0.32% | +0.90% |
| Change | -0.0035 | -0.0018 | -0.0001 | - | +0.0028 | +0.0047 | +0.0133 |
| Level | Intermediate | Intermediate | Intermediate | - | Minor | Major | Minor |
Pivot points can also be used to set your price objectives. Here is the price situation in relation to pivot points:
| Pivot points | S3 | S2 | S1 | PP | R1 | R2 | R3 |
|---|---|---|---|---|---|---|---|
| Standard | 1.4752 | 1.4771 | 1.4784 | 1.4803 | 1.4816 | 1.4835 | 1.4848 |
| Camarilla | 1.4788 | 1.4791 | 1.4794 | 1.4797 | 1.4800 | 1.4803 | 1.4806 |
| Woodie | 1.4749 | 1.4770 | 1.4781 | 1.4802 | 1.4813 | 1.4834 | 1.4845 |
| Fibonacci | 1.4771 | 1.4783 | 1.4791 | 1.4803 | 1.4815 | 1.4823 | 1.4835 |
| Pivot points | S3 | S2 | S1 | PP | R1 | R2 | R3 |
|---|---|---|---|---|---|---|---|
| Standard | 1.4594 | 1.4644 | 1.4686 | 1.4736 | 1.4778 | 1.4828 | 1.4870 |
| Camarilla | 1.4702 | 1.4710 | 1.4719 | 1.4727 | 1.4735 | 1.4744 | 1.4752 |
| Woodie | 1.4589 | 1.4642 | 1.4681 | 1.4734 | 1.4773 | 1.4826 | 1.4865 |
| Fibonacci | 1.4644 | 1.4680 | 1.4701 | 1.4736 | 1.4772 | 1.4793 | 1.4828 |
| Pivot points | S3 | S2 | S1 | PP | R1 | R2 | R3 |
|---|---|---|---|---|---|---|---|
| Standard | 1.4355 | 1.4450 | 1.4573 | 1.4668 | 1.4791 | 1.4886 | 1.5009 |
| Camarilla | 1.4635 | 1.4655 | 1.4675 | 1.4695 | 1.4715 | 1.4735 | 1.4755 |
| Woodie | 1.4368 | 1.4457 | 1.4586 | 1.4675 | 1.4804 | 1.4893 | 1.5022 |
| Fibonacci | 1.4450 | 1.4534 | 1.4585 | 1.4668 | 1.4752 | 1.4803 | 1.4886 |
Numerical data
The following are the details of the technical indicators and moving averages that were collected to generate this technical analysis:
| RSI (14): | 35.89 | |
| MACD (12,26,9): | -0.0004 | |
| Directional Movement: | -11.3059 | |
| AROON (14): | -35.7143 | |
| DEMA (21): | 1.4789 | |
| Parabolic SAR (0,02-0,02-0,2): | 1.4799 | |
| Elder Ray (13): | -0.0009 | |
| Super Trend (3,10): | 1.4808 | |
| Zig ZAG (10): | 1.4780 | |
| VORTEX (21): | 0.8916 | |
| Stochastique (14,3,5): | 15.08 | |
| TEMA (21): | 1.4784 | |
| Williams %R (14): | -92.00 | |
| Chande Momentum Oscillator (20): | -0.0017 | |
| Repulse (5,40,3): | -0.0730 | |
| ROCnROLL: | 2 | |
| TRIX (15,9): | -0.0023 | |
| Courbe Coppock: | 0.13 |
| MA7: | 1.4767 | |
| MA20: | 1.4710 | |
| MA50: | 1.4699 | |
| MA100: | 1.4658 | |
| MAexp7: | 1.4787 | |
| MAexp20: | 1.4793 | |
| MAexp50: | 1.4792 | |
| MAexp100: | 1.4781 | |
| Price / MA7: | +0.05% | |
| Price / MA20: | +0.44% | |
| Price / MA50: | +0.52% | |
| Price / MA100: | +0.80% | |
| Price / MAexp7: | -0.08% | |
| Price / MAexp20: | -0.12% | |
| Price / MAexp50: | -0.11% | |
| Price / MAexp100: | -0.04% |
News
The latest news and videos published on EUR/CAD at the time of the analysis were as follows:
-
 Forex Analysis: EUR/USD, GBP/USD, EUR/CAD - Amana Capital
-
Why I'm looking to sell EURCAD: Coleman
-
EUR/CAD To Hold Steady
-
EUR/CAD Bullish Breakthrough
-
Bullish Divergence – EURCAD
About author

Online


Add a comment
Comments
0 comments on the analysis EUR/CAD - 1H