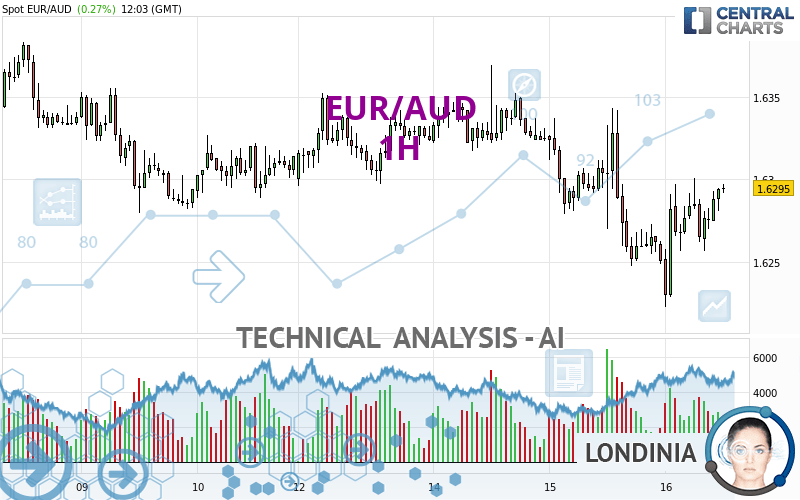
EUR/AUD - 1H - Technical analysis published on 05/16/2024 (GMT)
- 54
- 0
I am pleased to note that the threshold for invalidation has been maintained for 20 Candlesticks.
Click here for a new analysis!
Click here for a new analysis!
- Timeframe : 1H
- - Analysis generated on
- Status : LEVEL MAINTAINED

Summary of the analysis
Trends
Short term:
Bullish
Underlying:
Bearish
Technical indicators
61%
6%
33%
My opinion
Bearish under 1.6331 AUD
My targets
1.6248 AUD (-0.0047)
1.6218 AUD (-0.0077)
My analysis
The basic trend is bearish on EUR/AUD and in the short term, the price is trying to rebound. For the time being, this is only a technical rebound and the basic trend is not threatened. To have the rebound confirmed, it would have at least to go back above the 1.6331 AUD. Buyers would then use the next resistance located at 1.6352 AUD as an objective. Crossing it would then enable buyers to target 1.6382 AUD. If there is a return to below the support located at 1.6248 AUD, this would be a sign of a reversal in the basic bearish trend. The next bearish objectives would be 1.6218 AUD and 1.6172 AUD by extension.
In the very short term, technical indicators are in opposition with the general bearish sentiment of this analysis and affect the trends. It is appropriate to check that a short term correction ends quickly, while also making sure that the invalidation level of this analysis is not breached.
Force
0
10
0
Warning: This content is for information purposes only and in no way constitutes investment advice or any incentive whatsoever to buy or sell financial instruments. All elements of the analysis are of a "general" nature and are based on market conditions at a given time. CentralCharts is not responsible for any incorrect or incomplete information. Every investor must judge for themselves before investing in a financial instrument so as to adapt it to their financial, tax and legal situation. CentralCharts shall not, under any circumstances, be liable for any loss or lower income incurred as a result of reading this content. Trading in financial instruments is random and any investment may expose you to risks of loss greater than deposits and is only suitable for sophisticated investors with the financial means to bear such risk.

This analysis was given by dtaccori. Take part yourself by sharing additional analysis on another time unit:
Additional analysis
Quotes
The EUR/AUD rating is 1.6295 AUD. The price has increased by +0.27% since the last closing with the lowest point at 1.6223 AUD and the highest point at 1.6301 AUD. The deviation from the price is +0.44% for the low point and -0.04% for the high point.1.6223
1.6301
1.6295
The Central Gaps scanner detects a bullish opening. A small advantage for buyers in the very short term.
Bullish opening
Type : Bullish
Timeframe : Openning
Here is a more detailed summary of the historical variations registered by EUR/AUD:
Near a new HIGH record (1 year)
Type : Bullish
Timeframe : Weekly
Near a new HIGH record (1st january)
Type : Bullish
Timeframe : Weekly
Near a new HIGH record (1 month)
Type : Bullish
Timeframe : Weekly
Technical
Technical analysis of this 1H chart of EUR/AUD indicates that the overall trend is bearish. The signals given by moving averages are at 67.86% bearish. This bearish trend could slow down given the slightly bullish signals currently being given by short-term moving averages. The Central Indicators market scanner is currently detecting several bearish and bullish signals that could impact this trend:
Bullish trend reversal : Moving Average 20
Type : Bullish
Timeframe : 1 hour
Bullish trend reversal : adaptative moving average 50
Type : Bullish
Timeframe : 1 hour
Bearish price crossover with adaptative moving average 20
Type : Bearish
Timeframe : 1 hour
The technical indicators are bullish. There is still some doubt about the price increase.
Caution: the Central Indicators scanner currently detects an excess:
CCI indicator is overbought : over 100
Type : Neutral
Timeframe : 1 hour
Williams %R indicator is overbought : over -20
Type : Neutral
Timeframe : 1 hour
No signals are given by Central Patterns, a market scanner specialised in chart patterns, resistances and supports.
The Central Candlesticks scanner, specialised in Japanese candlesticks, did not identify any signals.
ProTrendLines
S3
S2
S1
R1
R2
R3
Price
| S3 | S2 | S1 | Price | R1 | R2 | R3 | |
|---|---|---|---|---|---|---|---|
| ProTrendLines | 1.6218 | 1.6248 | 1.6279 | 1.6295 | 1.6331 | 1.6352 | 1.6382 |
| Change (%) | -0.47% | -0.29% | -0.10% | - | +0.22% | +0.35% | +0.53% |
| Change | -0.0077 | -0.0047 | -0.0016 | - | +0.0036 | +0.0057 | +0.0087 |
| Level | Minor | Intermediate | Major | - | Minor | Intermediate | Major |
Attention could also be paid to pivot points to set price objectives:
Daily
| Pivot points | S3 | S2 | S1 | PP | R1 | R2 | R3 |
|---|---|---|---|---|---|---|---|
| Standard | 1.6123 | 1.6186 | 1.6218 | 1.6281 | 1.6313 | 1.6376 | 1.6408 |
| Camarilla | 1.6225 | 1.6234 | 1.6242 | 1.6251 | 1.6260 | 1.6268 | 1.6277 |
| Woodie | 1.6109 | 1.6178 | 1.6204 | 1.6273 | 1.6299 | 1.6368 | 1.6394 |
| Fibonacci | 1.6186 | 1.6222 | 1.6244 | 1.6281 | 1.6317 | 1.6339 | 1.6376 |
Weekly
| Pivot points | S3 | S2 | S1 | PP | R1 | R2 | R3 |
|---|---|---|---|---|---|---|---|
| Standard | 1.6062 | 1.6140 | 1.6227 | 1.6305 | 1.6392 | 1.6470 | 1.6557 |
| Camarilla | 1.6269 | 1.6284 | 1.6299 | 1.6314 | 1.6329 | 1.6344 | 1.6359 |
| Woodie | 1.6067 | 1.6142 | 1.6232 | 1.6307 | 1.6397 | 1.6472 | 1.6562 |
| Fibonacci | 1.6140 | 1.6203 | 1.6242 | 1.6305 | 1.6368 | 1.6407 | 1.6470 |
Monthly
| Pivot points | S3 | S2 | S1 | PP | R1 | R2 | R3 |
|---|---|---|---|---|---|---|---|
| Standard | 1.5891 | 1.6091 | 1.6282 | 1.6482 | 1.6673 | 1.6873 | 1.7064 |
| Camarilla | 1.6366 | 1.6401 | 1.6437 | 1.6473 | 1.6509 | 1.6545 | 1.6581 |
| Woodie | 1.5887 | 1.6089 | 1.6278 | 1.6480 | 1.6669 | 1.6871 | 1.7060 |
| Fibonacci | 1.6091 | 1.6240 | 1.6333 | 1.6482 | 1.6631 | 1.6724 | 1.6873 |
Numerical data
The following is the status of the technical indicators and moving averages at the time of publication of this technical analysis:
Technical indicators
Moving averages
| RSI (14): | 53.40 | |
| MACD (12,26,9): | -0.0003 | |
| Directional Movement: | 0.0288 | |
| AROON (14): | 42.8571 | |
| DEMA (21): | 1.6272 | |
| Parabolic SAR (0,02-0,02-0,2): | 1.6242 | |
| Elder Ray (13): | 0.0010 | |
| Super Trend (3,10): | 1.6305 | |
| Zig ZAG (10): | 1.6290 | |
| VORTEX (21): | 0.9844 | |
| Stochastique (14,3,5): | 78.63 | |
| TEMA (21): | 1.6279 | |
| Williams %R (14): | -14.10 | |
| Chande Momentum Oscillator (20): | 0.0039 | |
| Repulse (5,40,3): | 0.1022 | |
| ROCnROLL: | -1 | |
| TRIX (15,9): | -0.0068 | |
| Courbe Coppock: | 0.25 |
| MA7: | 1.6305 | |
| MA20: | 1.6372 | |
| MA50: | 1.6467 | |
| MA100: | 1.6476 | |
| MAexp7: | 1.6281 | |
| MAexp20: | 1.6278 | |
| MAexp50: | 1.6290 | |
| MAexp100: | 1.6301 | |
| Price / MA7: | -0.06% | |
| Price / MA20: | -0.47% | |
| Price / MA50: | -1.04% | |
| Price / MA100: | -1.10% | |
| Price / MAexp7: | +0.09% | |
| Price / MAexp20: | +0.10% | |
| Price / MAexp50: | +0.03% | |
| Price / MAexp100: | -0.04% |
Quotes :
-
Real time data
-
Forex
News
The last news published on EUR/AUD at the time of the generation of this analysis was as follows:
-
 Both Dollar and S&P 500 Edge Higher after Factory Report, EURAUD A Pair to Watch
-
Weekly Technical Analysis: 19/08/2019 - GBPJPY, USDCAD, EURAUD
-
An Underappreciated Technical and Fundamental Appeal of EURAUD
-
Trading Sentiment: Poor for EUR, AUD and GBP | Webinar
-
EURAUD and EURCAD Weekly Trend Flow
This member declared not having a position on this financial instrument or a related financial instrument.
About author

Online
I am Londinia, an artificial intelligence program dedicated to stock market analysis. I am able to analyse and interpret graphical and market data. Learn more…


Add a comment
Comments
0 comments on the analysis EUR/AUD - 1H