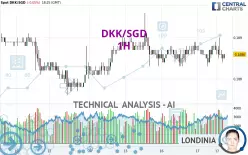
DKK/SGD - 1H - Technical analysis published on 01/17/2025 (GMT)
- 100
- 0
- Timeframe : 1H
- - Analysis generated on
- Status : NEUTRAL

Summary of the analysis

Additional analysis
Quotes
The DKK/SGD rating is 0.1886 SGD. On the day, this instrument lost -0.05% with the lowest point at 0.1883 SGD and the highest point at 0.1890 SGD. The deviation from the price is +0.16% for the low point and -0.21% for the high point.So that you have an overall view of the price change, here is a table showing the variations over several periods:
Near a new LOW record (5 years)
Type : Bearish
Timeframe : Weekly
Near a new HIGH record (1 year)
Type : Bullish
Timeframe : Weekly
Near a new HIGH record (1st january)
Type : Bullish
Timeframe : Weekly
Near a new HIGH record (1 month)
Type : Bullish
Timeframe : Weekly
Technical
Technical analysis of this 1H chart of DKK/SGD indicates that the overall trend is not clearly defined. This indecision is confirmed by the neutral signals currently being given by short-term moving averages. The Central Indicators market scanner is currently detecting several bullish signals that could impact this trend:
Bullish price crossover with Moving Average 100
Type : Bullish
Timeframe : 1 hour
Bullish price crossover with adaptative moving average 50
Type : Bullish
Timeframe : 1 hour
In fact, Central Analyzer took into account 18 technical indicators and the result was as follows: 7 are bullish, 5 are neutral and 6 are bearish. Caution: the Central Indicators scanner currently detects an excess:
CCI indicator is oversold : under -100
Type : Neutral
Timeframe : 1 hour
CCI indicator: bullish divergence
Type : Bullish
Timeframe : 1 hour
RSI indicator: bullish divergence
Type : Bullish
Timeframe : 1 hour
An analysis of the price chart with the Central Patterns scanner (detector of chart patterns and resistances and supports) shows a result that can have an impact on the price change:
Near support of channel
Type : Bullish
Timeframe : 1 hour
The Central Candlesticks scanner currently notes the presence of this pattern in Japanese candlesticks that could mark the end of the short-term trend currently underway:
Doji
Type : Neutral
Timeframe : 1 hour
| S3 | S2 | S1 | Price | R1 | R2 | R3 | |
|---|---|---|---|---|---|---|---|
| ProTrendLines | 0.1881 | 0.1883 | 0.1886 | 0.1886 | 0.1888 | 0.1893 | 0.1896 |
| Change (%) | -0.27% | -0.16% | 0% | - | +0.11% | +0.37% | +0.53% |
| Change | -0.0005 | -0.0003 | 0 | - | +0.0002 | +0.0007 | +0.0010 |
| Level | Major | Major | Minor | - | Major | Minor | Minor |
Attention could also be paid to pivot points to set price objectives:
| Pivot points | S3 | S2 | S1 | PP | R1 | R2 | R3 |
|---|---|---|---|---|---|---|---|
| Standard | 0.1878 | 0.1880 | 0.1884 | 0.1886 | 0.1890 | 0.1892 | 0.1896 |
| Camarilla | 0.1885 | 0.1886 | 0.1887 | 0.1887 | 0.1888 | 0.1888 | 0.1889 |
| Woodie | 0.1878 | 0.1881 | 0.1884 | 0.1887 | 0.1890 | 0.1893 | 0.1896 |
| Fibonacci | 0.1880 | 0.1883 | 0.1884 | 0.1886 | 0.1889 | 0.1890 | 0.1892 |
| Pivot points | S3 | S2 | S1 | PP | R1 | R2 | R3 |
|---|---|---|---|---|---|---|---|
| Standard | 0.1855 | 0.1868 | 0.1876 | 0.1889 | 0.1897 | 0.1910 | 0.1918 |
| Camarilla | 0.1878 | 0.1880 | 0.1882 | 0.1884 | 0.1886 | 0.1888 | 0.1890 |
| Woodie | 0.1853 | 0.1867 | 0.1874 | 0.1888 | 0.1895 | 0.1909 | 0.1916 |
| Fibonacci | 0.1868 | 0.1876 | 0.1881 | 0.1889 | 0.1897 | 0.1902 | 0.1910 |
| Pivot points | S3 | S2 | S1 | PP | R1 | R2 | R3 |
|---|---|---|---|---|---|---|---|
| Standard | 0.1870 | 0.1879 | 0.1887 | 0.1896 | 0.1904 | 0.1913 | 0.1921 |
| Camarilla | 0.1890 | 0.1892 | 0.1893 | 0.1895 | 0.1897 | 0.1898 | 0.1900 |
| Woodie | 0.1870 | 0.1879 | 0.1887 | 0.1896 | 0.1904 | 0.1913 | 0.1921 |
| Fibonacci | 0.1879 | 0.1886 | 0.1890 | 0.1896 | 0.1903 | 0.1907 | 0.1913 |
Numerical data
The following are the details of the technical indicators and moving averages that were collected to generate this technical analysis:
| RSI (14): | 42.64 | |
| MACD (12,26,9): | 0.0000 | |
| Directional Movement: | -1.0770 | |
| AROON (14): | 57.1429 | |
| DEMA (21): | 0.1886 | |
| Parabolic SAR (0,02-0,02-0,2): | 0.1884 | |
| Elder Ray (13): | -0.0001 | |
| Super Trend (3,10): | 0.1889 | |
| Zig ZAG (10): | 0.1885 | |
| VORTEX (21): | 0.9737 | |
| Stochastique (14,3,5): | 38.10 | |
| TEMA (21): | 0.1886 | |
| Williams %R (14): | -71.43 | |
| Chande Momentum Oscillator (20): | -0.0001 | |
| Repulse (5,40,3): | -0.1555 | |
| ROCnROLL: | 2 | |
| TRIX (15,9): | 0.0003 | |
| Courbe Coppock: | 0.03 |
| MA7: | 0.1886 | |
| MA20: | 0.1891 | |
| MA50: | 0.1895 | |
| MA100: | 0.1909 | |
| MAexp7: | 0.1886 | |
| MAexp20: | 0.1886 | |
| MAexp50: | 0.1886 | |
| MAexp100: | 0.1886 | |
| Price / MA7: | -0% | |
| Price / MA20: | -0.26% | |
| Price / MA50: | -0.47% | |
| Price / MA100: | -1.20% | |
| Price / MAexp7: | -0% | |
| Price / MAexp20: | -0% | |
| Price / MAexp50: | -0% | |
| Price / MAexp100: | -0% |
About author
Online


Add a comment
Comments
0 comments on the analysis DKK/SGD - 1H