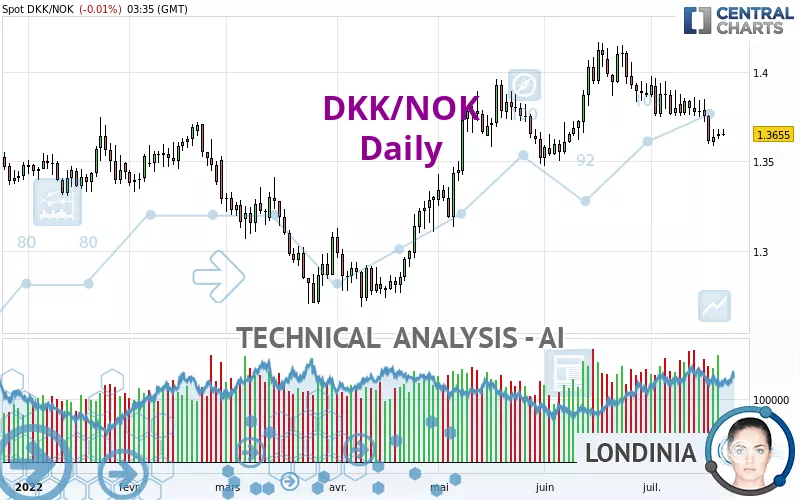
DKK/NOK - Daily - Technical analysis published on 07/22/2022 (GMT)
- 149
- 0
Click here for a new analysis!
- Timeframe : Daily
- - Analysis generated on
- Status : TARGET REACHED

Summary of the analysis

Additional analysis
Quotes
The DKK/NOK price is 1.3655 NOK. The price is lower by -0.01% since the last closing with the lowest point at 1.3645 NOK and the highest point at 1.3680 NOK. The deviation from the price is +0.07% for the low point and -0.18% for the high point.The Central Gaps scanner detects a bearish opening marking the presence of sellers ahead of buyers at the opening but not sufficiently marked to allow the price to register a quotation gap.
Bearish opening
Type : Bearish
Timeframe : Openning
Here is a more detailed summary of the historical variations registered by DKK/NOK:
Near a new HIGH record (1st january)
Type : Bullish
Timeframe : Weekly
Near a new HIGH record (1 month)
Type : Bullish
Timeframe : Weekly
Technical
Technical analysis of DKK/NOK in Daily shows a neutral overall trend. The trend could quickly turn bearish due to the strong bearish signals currently being given by short-term moving averages. An assessment of moving averages reveals a bearish signal that could impact this trend:
Moving Average bearish crossovers : MA20 & MA50
Type : Bearish
Timeframe : Daily
The probability of a further decline is low given the direction of the technical indicators.
Caution: the Central Indicators scanner currently detects an excess:
CCI indicator is oversold : under -100
Type : Neutral
Timeframe : Daily
Williams %R indicator is oversold : under -80
Type : Neutral
Timeframe : Daily
Pivot points : price is under support 3
Type : Neutral
Timeframe : Weekly
An analysis of the price chart with the Central Patterns scanner (detector of chart patterns and resistances and supports) shows a result that can have an impact on the price change:
Near support of channel
Type : Bullish
Timeframe : Daily
Central Candlesticks, the scanner specialised in Japanese candlesticks, detects this inversion signal that could impact the current short-term trend:
Doji
Type : Neutral
Timeframe : Daily
| S3 | S2 | S1 | Price | R1 | R2 | R3 | |
|---|---|---|---|---|---|---|---|
| ProTrendLines | 1.3077 | 1.3413 | 1.3642 | 1.3655 | 1.3766 | 1.3978 | 1.4125 |
| Change (%) | -4.23% | -1.77% | -0.10% | - | +0.81% | +2.37% | +3.44% |
| Change | -0.0578 | -0.0242 | -0.0013 | - | +0.0111 | +0.0323 | +0.0470 |
| Level | Minor | Major | Intermediate | - | Major | Major | Intermediate |
To determine price objectives, it is also possible to use the pivot points. Here is the price position in relation to pivot points:
| Pivot points | S3 | S2 | S1 | PP | R1 | R2 | R3 |
|---|---|---|---|---|---|---|---|
| Standard | 1.3565 | 1.3595 | 1.3625 | 1.3655 | 1.3685 | 1.3715 | 1.3745 |
| Camarilla | 1.3640 | 1.3645 | 1.3651 | 1.3656 | 1.3662 | 1.3667 | 1.3673 |
| Woodie | 1.3566 | 1.3595 | 1.3626 | 1.3655 | 1.3686 | 1.3715 | 1.3746 |
| Fibonacci | 1.3595 | 1.3618 | 1.3632 | 1.3655 | 1.3678 | 1.3692 | 1.3715 |
| Pivot points | S3 | S2 | S1 | PP | R1 | R2 | R3 |
|---|---|---|---|---|---|---|---|
| Standard | 1.3596 | 1.3672 | 1.3726 | 1.3802 | 1.3856 | 1.3932 | 1.3986 |
| Camarilla | 1.3745 | 1.3757 | 1.3769 | 1.3781 | 1.3793 | 1.3805 | 1.3817 |
| Woodie | 1.3586 | 1.3667 | 1.3716 | 1.3797 | 1.3846 | 1.3927 | 1.3976 |
| Fibonacci | 1.3672 | 1.3721 | 1.3752 | 1.3802 | 1.3851 | 1.3882 | 1.3932 |
| Pivot points | S3 | S2 | S1 | PP | R1 | R2 | R3 |
|---|---|---|---|---|---|---|---|
| Standard | 1.2814 | 1.3144 | 1.3509 | 1.3839 | 1.4204 | 1.4534 | 1.4899 |
| Camarilla | 1.3683 | 1.3747 | 1.3810 | 1.3874 | 1.3938 | 1.4001 | 1.4065 |
| Woodie | 1.2832 | 1.3153 | 1.3527 | 1.3848 | 1.4222 | 1.4543 | 1.4917 |
| Fibonacci | 1.3144 | 1.3410 | 1.3574 | 1.3839 | 1.4105 | 1.4269 | 1.4534 |
Numerical data
The following is the status of the technical indicators and moving averages at the time of publication of this technical analysis:
| RSI (14): | 41.34 | |
| MACD (12,26,9): | -0.0042 | |
| Directional Movement: | -7.8580 | |
| AROON (14): | -85.7143 | |
| DEMA (21): | 1.3728 | |
| Parabolic SAR (0,02-0,02-0,2): | 1.3816 | |
| Elder Ray (13): | -0.0074 | |
| Super Trend (3,10): | 1.4004 | |
| Zig ZAG (10): | 1.3656 | |
| VORTEX (21): | 0.8529 | |
| Stochastique (14,3,5): | 16.63 | |
| TEMA (21): | 1.3643 | |
| Williams %R (14): | -80.89 | |
| Chande Momentum Oscillator (20): | -0.0213 | |
| Repulse (5,40,3): | -0.4927 | |
| ROCnROLL: | 2 | |
| TRIX (15,9): | -0.0159 | |
| Courbe Coppock: | 2.59 |
| MA7: | 1.3697 | |
| MA20: | 1.3793 | |
| MA50: | 1.3797 | |
| MA100: | 1.3451 | |
| MAexp7: | 1.3691 | |
| MAexp20: | 1.3765 | |
| MAexp50: | 1.3723 | |
| MAexp100: | 1.3610 | |
| Price / MA7: | -0.31% | |
| Price / MA20: | -1.00% | |
| Price / MA50: | -1.03% | |
| Price / MA100: | +1.52% | |
| Price / MAexp7: | -0.26% | |
| Price / MAexp20: | -0.80% | |
| Price / MAexp50: | -0.50% | |
| Price / MAexp100: | +0.33% |
About author
Online


Add a comment
Comments
0 comments on the analysis DKK/NOK - Daily