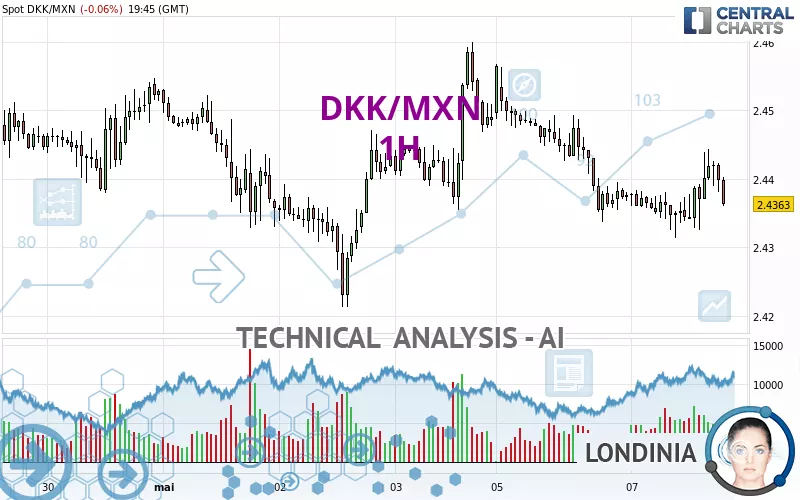
DKK/MXN - 1H - Technical analysis published on 05/07/2024 (GMT)
- 121
- 0
Click here for a new analysis!
- Timeframe : 1H
- - Analysis generated on
- Status : LEVEL MAINTAINED

Summary of the analysis

Additional analysis
Quotes
The DKK/MXN rating is 2.4363 MXN. The price registered a decrease of -0.06% on the session and was traded between 2.4314 MXN and 2.4444 MXN over the period. The price is currently at +0.20% from its lowest and -0.33% from its highest.A study of price movements over other periods shows the following variations:
Near a new LOW record (5 years)
Type : Bearish
Timeframe : Weekly
Near a new LOW record (1 year)
Type : Bearish
Timeframe : Weekly
Near a new HIGH record (1st january)
Type : Bullish
Timeframe : Weekly
Near a new HIGH record (1 month)
Type : Bullish
Timeframe : Weekly
Technical
Technical analysis of this 1H chart of DKK/MXN indicates that the overall trend is strongly bearish. 89.29% of the signals given by moving averages are bearish. This strongly bearish trend is supported by the strong bearish signals given by short-term moving averages. The Central Indicators scanner detects bearish signals on moving averages that could impact this trend:
Bearish trend reversal : adaptative moving average 50
Type : Bearish
Timeframe : 1 hour
Bearish trend reversal : adaptative moving average 100
Type : Bearish
Timeframe : 1 hour
Bearish price crossover with Moving Average 20
Type : Bearish
Timeframe : 1 hour
Bearish price crossover with adaptative moving average 20
Type : Bearish
Timeframe : 1 hour
On the 18 technical indicators analysed, 6 are bullish, 6 are neutral and 6 are bearish. Central Indicators, the scanner specialised in technical indicators, has identified these signals:
RSI indicator is back under 50
Type : Bearish
Timeframe : 1 hour
Price is back under the pivot point
Type : Bearish
Timeframe : Weekly
Williams %R indicator is back under -50
Type : Bearish
Timeframe : 1 hour
An analysis of the price chart with the Central Patterns scanner (detector of chart patterns and resistances and supports) shows several results that can have an impact on the price change:
Near horizontal resistance
Type : Bearish
Timeframe : 1 hour
Near support of triangle
Type : Bullish
Timeframe : 1 hour
No result was found by the Central Candlesticks scanner on Japanese candlesticks.
| S3 | S2 | S1 | Price | R1 | R2 | R3 | |
|---|---|---|---|---|---|---|---|
| ProTrendLines | 2.4077 | 2.4213 | 2.4275 | 2.4363 | 2.4378 | 2.4573 | 2.4784 |
| Change (%) | -1.17% | -0.62% | -0.36% | - | +0.06% | +0.86% | +1.73% |
| Change | -0.0286 | -0.0150 | -0.0088 | - | +0.0015 | +0.0210 | +0.0421 |
| Level | Minor | Intermediate | Major | - | Intermediate | Major | Minor |
Attention could also be paid to pivot points to set price objectives:
| Pivot points | S3 | S2 | S1 | PP | R1 | R2 | R3 |
|---|---|---|---|---|---|---|---|
| Standard | 2.4056 | 2.4196 | 2.4287 | 2.4427 | 2.4518 | 2.4658 | 2.4749 |
| Camarilla | 2.4314 | 2.4335 | 2.4356 | 2.4377 | 2.4398 | 2.4419 | 2.4441 |
| Woodie | 2.4031 | 2.4184 | 2.4262 | 2.4415 | 2.4493 | 2.4646 | 2.4724 |
| Fibonacci | 2.4196 | 2.4285 | 2.4339 | 2.4427 | 2.4516 | 2.4570 | 2.4658 |
| Pivot points | S3 | S2 | S1 | PP | R1 | R2 | R3 |
|---|---|---|---|---|---|---|---|
| Standard | 2.3632 | 2.3923 | 2.4204 | 2.4495 | 2.4776 | 2.5067 | 2.5348 |
| Camarilla | 2.4329 | 2.4381 | 2.4434 | 2.4486 | 2.4538 | 2.4591 | 2.4643 |
| Woodie | 2.3628 | 2.3921 | 2.4200 | 2.4493 | 2.4772 | 2.5065 | 2.5344 |
| Fibonacci | 2.3923 | 2.4141 | 2.4276 | 2.4495 | 2.4713 | 2.4848 | 2.5067 |
| Pivot points | S3 | S2 | S1 | PP | R1 | R2 | R3 |
|---|---|---|---|---|---|---|---|
| Standard | 2.1435 | 2.2478 | 2.3504 | 2.4547 | 2.5573 | 2.6616 | 2.7642 |
| Camarilla | 2.3960 | 2.4150 | 2.4339 | 2.4529 | 2.4719 | 2.4908 | 2.5098 |
| Woodie | 2.1426 | 2.2474 | 2.3495 | 2.4543 | 2.5564 | 2.6612 | 2.7633 |
| Fibonacci | 2.2478 | 2.3269 | 2.3757 | 2.4547 | 2.5338 | 2.5826 | 2.6616 |
Numerical data
The following is the status of the technical indicators and moving averages at the time of publication of this technical analysis:
| RSI (14): | 45.37 | |
| MACD (12,26,9): | -0.0003 | |
| Directional Movement: | -1.9506 | |
| AROON (14): | 50.0000 | |
| DEMA (21): | 2.4374 | |
| Parabolic SAR (0,02-0,02-0,2): | 2.4358 | |
| Elder Ray (13): | 0.0001 | |
| Super Trend (3,10): | 2.4426 | |
| Zig ZAG (10): | 2.4364 | |
| VORTEX (21): | 0.9868 | |
| Stochastique (14,3,5): | 63.59 | |
| TEMA (21): | 2.4386 | |
| Williams %R (14): | -60.00 | |
| Chande Momentum Oscillator (20): | 0.0008 | |
| Repulse (5,40,3): | -0.0850 | |
| ROCnROLL: | 2 | |
| TRIX (15,9): | -0.0066 | |
| Courbe Coppock: | 0.23 |
| MA7: | 2.4428 | |
| MA20: | 2.4293 | |
| MA50: | 2.4327 | |
| MA100: | 2.4620 | |
| MAexp7: | 2.4388 | |
| MAexp20: | 2.4383 | |
| MAexp50: | 2.4399 | |
| MAexp100: | 2.4417 | |
| Price / MA7: | -0.27% | |
| Price / MA20: | +0.29% | |
| Price / MA50: | +0.15% | |
| Price / MA100: | -1.04% | |
| Price / MAexp7: | -0.10% | |
| Price / MAexp20: | -0.08% | |
| Price / MAexp50: | -0.15% | |
| Price / MAexp100: | -0.22% |
About author
Online


Add a comment
Comments
0 comments on the analysis DKK/MXN - 1H