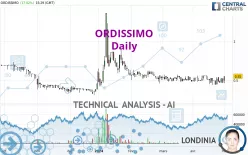
ORDISSIMO - Daily - Technical analysis published on 05/02/2024 (GMT)
- 139
- 0
Click here for a new analysis!
- Timeframe : Daily
- - Analysis generated on
- Status : TARGET REACHED

Summary of the analysis

Additional analysis
Quotes
The ORDISSIMO rating is 0.550 EUR. The price has increased by +17.02% since the last closing and was between 0.466 EUR and 0.550 EUR. This implies that the price is at +18.03% from its lowest and at 0% from its highest.A bullish opening was detected by the Central Gaps scanner. Buyers are trying to impose a bullish momentum in the very short term.
Bullish opening
Type : Bullish
Timeframe : Openning
So that you have an overall view of the price change, here is a table showing the variations over several periods:
Near a new HIGH record (1 month)
Type : Bullish
Timeframe : Weekly
Technical
Technical analysis of this Daily chart of ORDISSIMO indicates that the overall trend is bullish. 64.29% of the signals given by moving averages are bullish. The overall trend is reinforced by the strong bullish signals from short-term moving averages. The Central Indicators market scanner is currently detecting several bullish signals that could impact this trend:
Bullish price crossover with Moving Average 20
Type : Bullish
Timeframe : Daily
Bullish price crossover with Moving Average 50
Type : Bullish
Timeframe : Daily
Bullish price crossover with Moving Average 100
Type : Bullish
Timeframe : Daily
Bullish price crossover with adaptative moving average 50
Type : Bullish
Timeframe : Daily
Bullish price crossover with adaptative moving average 100
Type : Bullish
Timeframe : Daily
In fact, only 9 technical indicators out of 18 studied are currently positioned bullish. Caution: the Central Indicators scanner currently detects an excess:
MACD indicator: bullish divergence
Type : Bullish
Timeframe : Daily
Williams %R indicator is overbought : over -20
Type : Neutral
Timeframe : Daily
Pivot points : price is over resistance 1
Type : Neutral
Timeframe : Weekly
Pivot points : price is over resistance 2
Type : Neutral
Timeframe : Daily
RSI indicator is back over 50
Type : Bullish
Timeframe : Daily
MACD crosses UP its Moving Average
Type : Bullish
Timeframe : Daily
An analysis of the price chart with the Central Patterns scanner (detector of chart patterns and resistances and supports) shows a result that can have an impact on the price change:
Near resistance of channel
Type : Bearish
Timeframe : Daily
The Central Candlesticks scanner, specialised in Japanese candlesticks, did not identify any signals.
| S2 | S1 | Price | R1 | R2 | R3 | |
|---|---|---|---|---|---|---|
| ProTrendLines | 0.330 | 0.420 | 0.550 | 0.561 | 0.699 | 1.360 |
| Change (%) | -40.00% | -23.64% | - | +2.00% | +27.09% | +147.27% |
| Change | -0.220 | -0.130 | - | +0.011 | +0.149 | +0.810 |
| Level | Major | Intermediate | - | Minor | Intermediate | Minor |
Pivot points can also be used to set your price objectives. Here is the price situation in relation to pivot points:
| Pivot points | S3 | S2 | S1 | PP | R1 | R2 | R3 |
|---|---|---|---|---|---|---|---|
| Standard | 0.410 | 0.438 | 0.494 | 0.522 | 0.578 | 0.606 | 0.662 |
| Camarilla | 0.527 | 0.535 | 0.542 | 0.550 | 0.558 | 0.565 | 0.573 |
| Woodie | 0.424 | 0.445 | 0.508 | 0.529 | 0.592 | 0.613 | 0.676 |
| Fibonacci | 0.438 | 0.470 | 0.490 | 0.522 | 0.554 | 0.574 | 0.606 |
| Pivot points | S3 | S2 | S1 | PP | R1 | R2 | R3 |
|---|---|---|---|---|---|---|---|
| Standard | 0.336 | 0.391 | 0.431 | 0.486 | 0.526 | 0.581 | 0.621 |
| Camarilla | 0.446 | 0.455 | 0.463 | 0.472 | 0.481 | 0.489 | 0.498 |
| Woodie | 0.330 | 0.387 | 0.425 | 0.482 | 0.520 | 0.577 | 0.615 |
| Fibonacci | 0.391 | 0.427 | 0.449 | 0.486 | 0.522 | 0.544 | 0.581 |
| Pivot points | S3 | S2 | S1 | PP | R1 | R2 | R3 |
|---|---|---|---|---|---|---|---|
| Standard | 0.302 | 0.371 | 0.421 | 0.490 | 0.540 | 0.609 | 0.659 |
| Camarilla | 0.437 | 0.448 | 0.459 | 0.470 | 0.481 | 0.492 | 0.503 |
| Woodie | 0.292 | 0.366 | 0.411 | 0.485 | 0.530 | 0.604 | 0.649 |
| Fibonacci | 0.371 | 0.417 | 0.445 | 0.490 | 0.536 | 0.564 | 0.609 |
Numerical data
The following is the status of the technical indicators and moving averages at the time of publication of this technical analysis:
| RSI (14): | 54.31 | |
| MACD (12,26,9): | -0.0070 | |
| Directional Movement: | 3.425 | |
| AROON (14): | -35.714 | |
| DEMA (21): | 0.500 | |
| Parabolic SAR (0,02-0,02-0,2): | 0.451 | |
| Elder Ray (13): | 0.001 | |
| Super Trend (3,10): | 0.604 | |
| Zig ZAG (10): | 0.550 | |
| VORTEX (21): | 0.9630 | |
| Stochastique (14,3,5): | 61.35 | |
| TEMA (21): | 0.503 | |
| Williams %R (14): | -8.40 | |
| Chande Momentum Oscillator (20): | -0.008 | |
| Repulse (5,40,3): | 8.6730 | |
| ROCnROLL: | 1 | |
| TRIX (15,9): | -0.2210 | |
| Courbe Coppock: | 9.59 |
| MA7: | 0.496 | |
| MA20: | 0.513 | |
| MA50: | 0.523 | |
| MA100: | 0.549 | |
| MAexp7: | 0.507 | |
| MAexp20: | 0.510 | |
| MAexp50: | 0.526 | |
| MAexp100: | 0.549 | |
| Price / MA7: | +10.89% | |
| Price / MA20: | +7.21% | |
| Price / MA50: | +5.16% | |
| Price / MA100: | +0.18% | |
| Price / MAexp7: | +8.48% | |
| Price / MAexp20: | +7.84% | |
| Price / MAexp50: | +4.56% | |
| Price / MAexp100: | +0.18% |
About author

Online


Add a comment
Comments
0 comments on the analysis ORDISSIMO - Daily