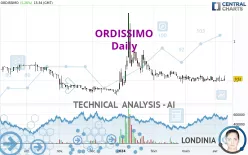
ORDISSIMO - Daily - Technical analysis published on 04/10/2024 (GMT)
- 109
- 0
- Timeframe : Daily
- - Analysis generated on
- Status : NEUTRAL

Summary of the analysis

Additional analysis
Quotes
The ORDISSIMO price is 0.520 EUR. The price registered an increase of +5.26% on the session with the lowest point at 0.496 EUR and the highest point at 0.560 EUR. The deviation from the price is +4.84% for the low point and -7.14% for the high point.The Central Gaps scanner detects a bullish opening marking the presence of buyers ahead of sellers at the opening but not sufficiently marked to allow the price to register a quotation gap.
Bullish opening
Type : Bullish
Timeframe : Openning
Here is a more detailed summary of the historical variations registered by ORDISSIMO:
Near a new HIGH record (1 month)
Type : Bullish
Timeframe : Weekly
Technical
A technical analysis in Daily of this ORDISSIMO chart shows a slightly bearish trend. Only 57.14% of the signals given by moving averages are bearish. This slightly bearish trend could return to neutral given the neutral signals also given by short-term moving averages. The Central Indicators scanner detects bullish signals on moving averages that could impact this trend:
Bullish price crossover with Moving Average 20
Type : Bullish
Timeframe : Daily
Bullish price crossover with adaptative moving average 100
Type : Bullish
Timeframe : Daily
An assessment of technical indicators shows a slightly bullish signal.
Caution: the Central Indicators scanner currently detects an excess:
CCI indicator: bullish divergence
Type : Bullish
Timeframe : Daily
Pivot points : price is over resistance 3
Type : Neutral
Timeframe : Daily
Momentum indicator is back over 0
Type : Bullish
Timeframe : Daily
No signals are given by Central Patterns, a market scanner specialised in chart patterns, resistances and supports.
The Central Candlesticks scanner which studies Japanese candlesticks did not detect anything.
| S2 | S1 | Price | R1 | R2 | R3 | |
|---|---|---|---|---|---|---|
| ProTrendLines | 0.330 | 0.491 | 0.520 | 0.699 | 0.830 | 1.360 |
| Change (%) | -36.54% | -5.58% | - | +34.42% | +59.62% | +161.54% |
| Change | -0.190 | -0.029 | - | +0.179 | +0.310 | +0.840 |
| Level | Major | Intermediate | - | Intermediate | Minor | Intermediate |
Attention could also be paid to pivot points to set price objectives:
| Pivot points | S3 | S2 | S1 | PP | R1 | R2 | R3 |
|---|---|---|---|---|---|---|---|
| Standard | 0.427 | 0.461 | 0.491 | 0.525 | 0.555 | 0.589 | 0.619 |
| Camarilla | 0.502 | 0.508 | 0.514 | 0.520 | 0.526 | 0.532 | 0.538 |
| Woodie | 0.424 | 0.460 | 0.488 | 0.524 | 0.552 | 0.588 | 0.616 |
| Fibonacci | 0.461 | 0.486 | 0.501 | 0.525 | 0.550 | 0.565 | 0.589 |
| Pivot points | S3 | S2 | S1 | PP | R1 | R2 | R3 |
|---|---|---|---|---|---|---|---|
| Standard | 0.407 | 0.443 | 0.487 | 0.523 | 0.567 | 0.603 | 0.647 |
| Camarilla | 0.508 | 0.515 | 0.523 | 0.530 | 0.537 | 0.545 | 0.552 |
| Woodie | 0.410 | 0.445 | 0.490 | 0.525 | 0.570 | 0.605 | 0.650 |
| Fibonacci | 0.443 | 0.474 | 0.493 | 0.523 | 0.554 | 0.573 | 0.603 |
| Pivot points | S3 | S2 | S1 | PP | R1 | R2 | R3 |
|---|---|---|---|---|---|---|---|
| Standard | 0.370 | 0.426 | 0.458 | 0.514 | 0.546 | 0.602 | 0.634 |
| Camarilla | 0.466 | 0.474 | 0.482 | 0.490 | 0.498 | 0.506 | 0.514 |
| Woodie | 0.358 | 0.420 | 0.446 | 0.508 | 0.534 | 0.596 | 0.622 |
| Fibonacci | 0.426 | 0.460 | 0.480 | 0.514 | 0.548 | 0.568 | 0.602 |
Numerical data
The following is the status of the technical indicators and moving averages at the time of publication of this technical analysis:
| RSI (14): | 49.17 | |
| MACD (12,26,9): | -0.0100 | |
| Directional Movement: | 16.443 | |
| AROON (14): | 14.285 | |
| DEMA (21): | 0.504 | |
| Parabolic SAR (0,02-0,02-0,2): | 0.561 | |
| Elder Ray (13): | 0.013 | |
| Super Trend (3,10): | 0.611 | |
| Zig ZAG (10): | 0.520 | |
| VORTEX (21): | 0.9160 | |
| Stochastique (14,3,5): | 30.42 | |
| TEMA (21): | 0.508 | |
| Williams %R (14): | -50.00 | |
| Chande Momentum Oscillator (20): | 0.020 | |
| Repulse (5,40,3): | 1.5510 | |
| ROCnROLL: | -1 | |
| TRIX (15,9): | -0.3300 | |
| Courbe Coppock: | 3.04 |
| MA7: | 0.515 | |
| MA20: | 0.519 | |
| MA50: | 0.544 | |
| MA100: | 0.533 | |
| MAexp7: | 0.512 | |
| MAexp20: | 0.523 | |
| MAexp50: | 0.540 | |
| MAexp100: | 0.566 | |
| Price / MA7: | +0.97% | |
| Price / MA20: | +0.19% | |
| Price / MA50: | -4.41% | |
| Price / MA100: | -2.44% | |
| Price / MAexp7: | +1.56% | |
| Price / MAexp20: | -0.57% | |
| Price / MAexp50: | -3.70% | |
| Price / MAexp100: | -8.13% |
About author

Online


Add a comment
Comments
0 comments on the analysis ORDISSIMO - Daily