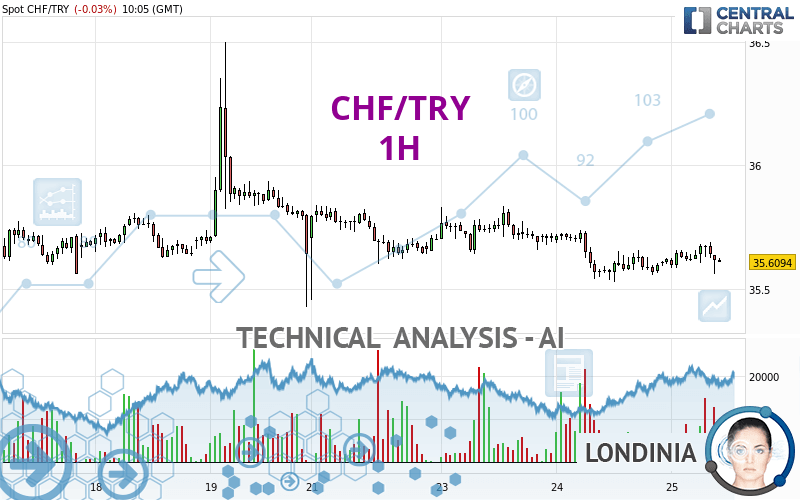
CHF/TRY - 1H - Technical analysis published on 04/25/2024 (GMT)
- 98
- 0
Click here for a new analysis!
- Timeframe : 1H
- - Analysis generated on
- Status : INVALID

Summary of the analysis

Additional analysis
Quotes
The CHF/TRY price is 35.6094 TRY. The price is lower by -0.03% since the last closing and was between 35.5588 TRY and 35.6873 TRY. This implies that the price is at +0.14% from its lowest and at -0.22% from its highest.The Central Gaps scanner detects a bearish opening marking the presence of sellers ahead of buyers at the opening but not sufficiently marked to allow the price to register a quotation gap.
Bearish opening
Type : Bearish
Timeframe : Openning
A study of price movements over other periods shows the following variations:
Near a new HIGH record (5 years)
Type : Bullish
Timeframe : Weekly
Near a new HIGH record (1 year)
Type : Bullish
Timeframe : Weekly
Near a new HIGH record (1st january)
Type : Bullish
Timeframe : Weekly
Near a new HIGH record (1 month)
Type : Bullish
Timeframe : Weekly
Abnormal volumes on CHF/TRY were detected by the Central Volumes scanner:
Abnormal volumes
Timeframe : 5 days
Abnormal volumes
Timeframe : 20 days
Abnormal volumes
Timeframe : 50 days
Technical
Technical analysis of CHF/TRY in 1H shows a overall strongly bearish trend. 89.29% of the signals given by moving averages are bearish. This strongly bearish trend is showing signs of slowing down given the slightly bearish signals given by short-term moving averages. The Central Indicators market scanner is currently detecting several bearish signals that could impact this trend:
Bearish trend reversal : adaptative moving average 20
Type : Bearish
Timeframe : 1 hour
Bearish price crossover with adaptative moving average 20
Type : Bearish
Timeframe : 1 hour
An assessment of technical indicators does not currently provide any relevant information on the direction of future price movements.
Central Indicators, the detector scanner for these technical indicators has recently detected several signals:
RSI indicator is back under 50
Type : Bearish
Timeframe : 1 hour
Parabolic SAR indicator bearish reversal
Type : Bearish
Timeframe : 1 hour
MACD indicator is back under 0
Type : Bearish
Timeframe : 1 hour
Williams %R indicator is back under -50
Type : Bearish
Timeframe : 1 hour
The Central Patterns scanner, which studies chart patterns, resistances and supports, has identified these signals:
Near horizontal resistance
Type : Bearish
Timeframe : 1 hour
Resistance of channel is broken
Type : Bullish
Timeframe : 1 hour
Central Candlesticks, the scanner specialised in Japanese candlesticks, detects this inversion signal that could impact the current short-term trend:
Black hanging man / hammer
Type : Neutral
Timeframe : 1 hour
| S3 | S2 | S1 | Price | R1 | R2 | R3 | |
|---|---|---|---|---|---|---|---|
| ProTrendLines | 35.3330 | 35.4212 | 35.5259 | 35.6094 | 35.6500 | 35.8341 | 35.9329 |
| Change (%) | -0.78% | -0.53% | -0.23% | - | +0.11% | +0.63% | +0.91% |
| Change | -0.2764 | -0.1882 | -0.0835 | - | +0.0406 | +0.2247 | +0.3235 |
| Level | Major | Minor | Intermediate | - | Intermediate | Major | Intermediate |
Attention could also be paid to pivot points to set price objectives:
| Pivot points | S3 | S2 | S1 | PP | R1 | R2 | R3 |
|---|---|---|---|---|---|---|---|
| Standard | 35.3020 | 35.4137 | 35.5164 | 35.6281 | 35.7308 | 35.8425 | 35.9452 |
| Camarilla | 35.5601 | 35.5798 | 35.5995 | 35.6191 | 35.6388 | 35.6584 | 35.6781 |
| Woodie | 35.2975 | 35.4115 | 35.5119 | 35.6259 | 35.7263 | 35.8403 | 35.9407 |
| Fibonacci | 35.4137 | 35.4956 | 35.5462 | 35.6281 | 35.7100 | 35.7606 | 35.8425 |
| Pivot points | S3 | S2 | S1 | PP | R1 | R2 | R3 |
|---|---|---|---|---|---|---|---|
| Standard | 33.9888 | 34.6636 | 35.1520 | 35.8268 | 36.3152 | 36.9900 | 37.4784 |
| Camarilla | 35.3204 | 35.4271 | 35.5337 | 35.6403 | 35.7469 | 35.8536 | 35.9602 |
| Woodie | 33.8955 | 34.6170 | 35.0587 | 35.7802 | 36.2219 | 36.9434 | 37.3851 |
| Fibonacci | 34.6636 | 35.1080 | 35.3825 | 35.8268 | 36.2712 | 36.5457 | 36.9900 |
| Pivot points | S3 | S2 | S1 | PP | R1 | R2 | R3 |
|---|---|---|---|---|---|---|---|
| Standard | 32.9235 | 34.0921 | 34.9631 | 36.1317 | 37.0027 | 38.1713 | 39.0423 |
| Camarilla | 35.2732 | 35.4602 | 35.6471 | 35.8341 | 36.0211 | 36.2080 | 36.3950 |
| Woodie | 32.7747 | 34.0177 | 34.8143 | 36.0573 | 36.8539 | 38.0969 | 38.8935 |
| Fibonacci | 34.0921 | 34.8712 | 35.3526 | 36.1317 | 36.9108 | 37.3922 | 38.1713 |
Numerical data
The following is the status of technical indicators and moving averages registered at the time this technical analysis was created:
| RSI (14): | 48.14 | |
| MACD (12,26,9): | -0.0005 | |
| Directional Movement: | -4.7610 | |
| AROON (14): | 85.7142 | |
| DEMA (21): | 35.6262 | |
| Parabolic SAR (0,02-0,02-0,2): | 35.6873 | |
| Elder Ray (13): | -0.0344 | |
| Super Trend (3,10): | 35.7105 | |
| Zig ZAG (10): | 35.6290 | |
| VORTEX (21): | 1.0291 | |
| Stochastique (14,3,5): | 68.91 | |
| TEMA (21): | 35.6416 | |
| Williams %R (14): | -50.69 | |
| Chande Momentum Oscillator (20): | 0.0198 | |
| Repulse (5,40,3): | 0.0411 | |
| ROCnROLL: | 2 | |
| TRIX (15,9): | -0.0035 | |
| Courbe Coppock: | 0.24 |
| MA7: | 35.6647 | |
| MA20: | 35.5810 | |
| MA50: | 35.7266 | |
| MA100: | 35.1690 | |
| MAexp7: | 35.6371 | |
| MAexp20: | 35.6311 | |
| MAexp50: | 35.6527 | |
| MAexp100: | 35.6721 | |
| Price / MA7: | -0.16% | |
| Price / MA20: | +0.08% | |
| Price / MA50: | -0.33% | |
| Price / MA100: | +1.25% | |
| Price / MAexp7: | -0.08% | |
| Price / MAexp20: | -0.06% | |
| Price / MAexp50: | -0.12% | |
| Price / MAexp100: | -0.18% |
About author
Online


Add a comment
Comments
0 comments on the analysis CHF/TRY - 1H