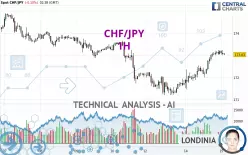
CHF/JPY - 1H - Technical analysis published on 01/15/2025 (GMT)
- 192
- 0
Click here for a new analysis!
- Timeframe : 1H
- - Analysis generated on
- Status : INVALID

Summary of the analysis

Additional analysis
Quotes
CHF/JPY rating 173.03 JPY. The price is lower by -0.10% since the last closing and was traded between 173.00 JPY and 173.24 JPY over the period. The price is currently at +0.02% from its lowest and -0.12% from its highest.Here is a more detailed summary of the historical variations registered by CHF/JPY:
Near a new HIGH record (5 years)
Type : Bullish
Timeframe : Weekly
Near a new LOW record (1 year)
Type : Bearish
Timeframe : Weekly
Near a new HIGH record (1st january)
Type : Bullish
Timeframe : Weekly
Near a new HIGH record (1 month)
Type : Bullish
Timeframe : Weekly
Technical
Technical analysis of this 1H chart of CHF/JPY indicates that the overall trend is bullish. 75.00% of the signals given by moving averages are bullish. The overall trend is reinforced by the strong bullish signals from short-term moving averages. The Central Indicators scanner does not detect any result on moving averages that would impact this trend.
An assessment of technical indicators does not currently provide any relevant information to suggest whether the signal given by the technical indicators is more bullish or bearish.
But beware of excesses. The Central Indicators scanner currently detects this:
Williams %R indicator is overbought : over -20
Type : Neutral
Timeframe : 1 hour
Price is back over the pivot point
Type : Bullish
Timeframe : Weekly
The Central Patterns scanner, which studies chart patterns, resistances and supports, has identified these signals:
Near horizontal resistance
Type : Bearish
Timeframe : 1 hour
Resistance of channel is broken
Type : Bullish
Timeframe : 1 hour
There is also a Japanese candlestick pattern detected by Central Candlesticks that could mark the end of the current short-term trend:
Doji
Type : Neutral
Timeframe : 1 hour
| S3 | S2 | S1 | Price | R1 | R2 | R3 | |
|---|---|---|---|---|---|---|---|
| ProTrendLines | 172.00 | 172.36 | 172.88 | 173.03 | 173.22 | 173.67 | 174.31 |
| Change (%) | -0.60% | -0.39% | -0.09% | - | +0.11% | +0.37% | +0.74% |
| Change | -1.03 | -0.67 | -0.15 | - | +0.19 | +0.64 | +1.28 |
| Level | Minor | Major | Minor | - | Intermediate | Intermediate | Intermediate |
Attention could also be paid to pivot points to set price objectives:
| Pivot points | S3 | S2 | S1 | PP | R1 | R2 | R3 |
|---|---|---|---|---|---|---|---|
| Standard | 170.25 | 170.86 | 172.03 | 172.64 | 173.81 | 174.42 | 175.59 |
| Camarilla | 172.71 | 172.87 | 173.04 | 173.20 | 173.36 | 173.53 | 173.69 |
| Woodie | 170.53 | 171.00 | 172.31 | 172.78 | 174.09 | 174.56 | 175.87 |
| Fibonacci | 170.86 | 171.54 | 171.96 | 172.64 | 173.32 | 173.74 | 174.42 |
| Pivot points | S3 | S2 | S1 | PP | R1 | R2 | R3 |
|---|---|---|---|---|---|---|---|
| Standard | 167.76 | 169.74 | 170.94 | 172.92 | 174.12 | 176.10 | 177.30 |
| Camarilla | 171.26 | 171.55 | 171.84 | 172.13 | 172.42 | 172.71 | 173.01 |
| Woodie | 167.36 | 169.55 | 170.54 | 172.73 | 173.72 | 175.91 | 176.90 |
| Fibonacci | 169.74 | 170.96 | 171.71 | 172.92 | 174.14 | 174.89 | 176.10 |
| Pivot points | S3 | S2 | S1 | PP | R1 | R2 | R3 |
|---|---|---|---|---|---|---|---|
| Standard | 161.13 | 164.58 | 168.93 | 172.38 | 176.73 | 180.18 | 184.53 |
| Camarilla | 171.13 | 171.84 | 172.56 | 173.27 | 173.99 | 174.70 | 175.42 |
| Woodie | 161.57 | 164.81 | 169.37 | 172.61 | 177.17 | 180.41 | 184.97 |
| Fibonacci | 164.58 | 167.56 | 169.40 | 172.38 | 175.36 | 177.20 | 180.18 |
Numerical data
The following is the status of the technical indicators and moving averages at the time of publication of this technical analysis:
| RSI (14): | 67.92 | |
| MACD (12,26,9): | 0.3000 | |
| Directional Movement: | 15.51 | |
| AROON (14): | 64.29 | |
| DEMA (21): | 173.14 | |
| Parabolic SAR (0,02-0,02-0,2): | 173.25 | |
| Elder Ray (13): | 0.14 | |
| Super Trend (3,10): | 172.41 | |
| Zig ZAG (10): | 173.06 | |
| VORTEX (21): | 1.2300 | |
| Stochastique (14,3,5): | 85.60 | |
| TEMA (21): | 173.31 | |
| Williams %R (14): | -16.80 | |
| Chande Momentum Oscillator (20): | 0.68 | |
| Repulse (5,40,3): | -0.0600 | |
| ROCnROLL: | 1 | |
| TRIX (15,9): | 0.0300 | |
| Courbe Coppock: | 0.94 |
| MA7: | 173.00 | |
| MA20: | 173.61 | |
| MA50: | 173.25 | |
| MA100: | 172.52 | |
| MAexp7: | 173.05 | |
| MAexp20: | 172.76 | |
| MAexp50: | 172.48 | |
| MAexp100: | 172.60 | |
| Price / MA7: | +0.02% | |
| Price / MA20: | -0.33% | |
| Price / MA50: | -0.13% | |
| Price / MA100: | +0.30% | |
| Price / MAexp7: | -0.01% | |
| Price / MAexp20: | +0.16% | |
| Price / MAexp50: | +0.32% | |
| Price / MAexp100: | +0.25% |
News
Don't forget to follow the news on CHF/JPY. At the time of publication of this analysis, the latest news was as follows:
-
 CHF/JPY Forecast November 20, 2024
-
CHF/JPY Forecast October 18, 2024
-
CHF/JPY Forecast August 13, 2024
-
CHF/JPY Forecast August 5, 2024
-
CHF/JPY Forecast July 29, 2024
About author

Online


Add a comment
Comments
0 comments on the analysis CHF/JPY - 1H