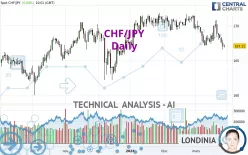
CHF/JPY - Daily - Technical analysis published on 03/28/2024 (GMT)
- 121
- 0
Click here for a new analysis!
- Timeframe : Daily
- - Analysis generated on
- Status : INVALID
Summary of the analysis

Additional analysis
Quotes
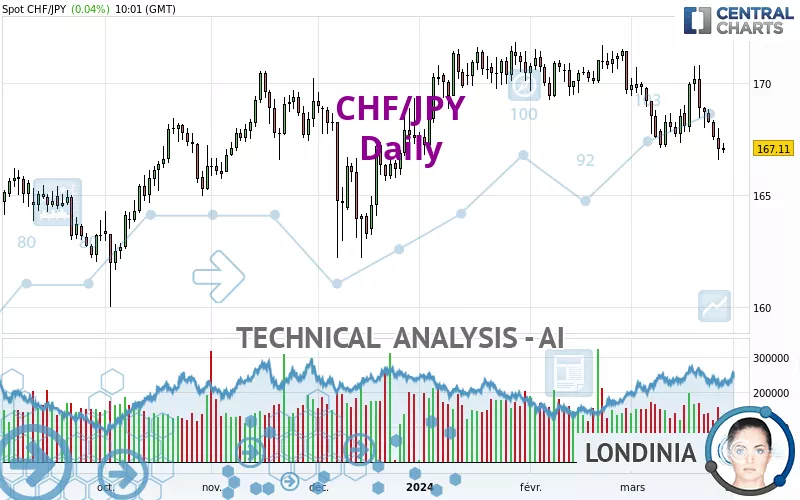
The CHF/JPY rating is 167.10 JPY. On the day, this instrument gained +0.04% and was between 166.90 JPY and 167.32 JPY. This implies that the price is at +0.12% from its lowest and at -0.13% from its highest.The Central Gaps scanner detects a bearish opening. A small advantage for sellers in the very short term.
Bearish opening
Type : Bearish
Timeframe : Openning
Here is a more detailed summary of the historical variations registered by CHF/JPY:
Near a new HIGH record (5 years)
Type : Bullish
Timeframe : Weekly
Near a new HIGH record (1 year)
Type : Bullish
Timeframe : Weekly
Near a new HIGH record (1st january)
Type : Bullish
Timeframe : Weekly
Near a new HIGH record (1 month)
Type : Bullish
Timeframe : Weekly
Technical
A technical analysis in Daily of this CHF/JPY chart shows a bearish trend. 71.43% of the signals given by moving averages are bearish. This bearish trend is supported by the strong bearish signals given by short-term moving averages. An assessment of moving averages reveals a bearish signal that could impact this trend:
Moving Average bearish crossovers : AMA50 & AMA100
Type : Bearish
Timeframe : Daily
Technical indicators are bearish. There is still some doubt about the decline in the price.
Caution: the Central Indicators scanner currently detects an excess:
CCI indicator is oversold : under -100
Type : Neutral
Timeframe : Daily
CCI indicator: bullish divergence
Type : Bullish
Timeframe : Daily
RSI indicator: bullish divergence
Type : Bullish
Timeframe : Daily
Williams %R indicator is oversold : under -80
Type : Neutral
Timeframe : Daily
Pivot points : price is under support 1
Type : Neutral
Timeframe : Weekly
The Central Patterns scanner, which studies chart patterns, resistances and supports, has identified these signals:
Horizontal support is broken
Type : Bearish
Timeframe : Daily
Support of channel is broken
Type : Bearish
Timeframe : Daily
The Central Candlesticks scanner which studies Japanese candlesticks did not detect anything.
| S3 | S2 | S1 | Price | R1 | R2 | R3 | |
|---|---|---|---|---|---|---|---|
| ProTrendLines | 159.80 | 161.96 | 163.26 | 167.10 | 167.25 | 169.41 | 170.43 |
| Change (%) | -4.37% | -3.08% | -2.30% | - | +0.09% | +1.38% | +1.99% |
| Change | -7.30 | -5.14 | -3.84 | - | +0.15 | +2.31 | +3.33 |
| Level | Minor | Intermediate | Major | - | Minor | Intermediate | Minor |
Attention could also be paid to pivot points to set price objectives:
| Pivot points | S3 | S2 | S1 | PP | R1 | R2 | R3 |
|---|---|---|---|---|---|---|---|
| Standard | 164.98 | 165.77 | 166.41 | 167.20 | 167.84 | 168.63 | 169.27 |
| Camarilla | 166.65 | 166.78 | 166.91 | 167.04 | 167.17 | 167.30 | 167.43 |
| Woodie | 164.90 | 165.73 | 166.33 | 167.16 | 167.76 | 168.59 | 169.19 |
| Fibonacci | 165.77 | 166.32 | 166.66 | 167.20 | 167.75 | 168.09 | 168.63 |
| Pivot points | S3 | S2 | S1 | PP | R1 | R2 | R3 |
|---|---|---|---|---|---|---|---|
| Standard | 164.42 | 166.13 | 167.41 | 169.12 | 170.40 | 172.11 | 173.39 |
| Camarilla | 167.88 | 168.15 | 168.43 | 168.70 | 168.97 | 169.25 | 169.52 |
| Woodie | 164.22 | 166.02 | 167.21 | 169.01 | 170.20 | 172.00 | 173.19 |
| Fibonacci | 166.13 | 167.27 | 167.97 | 169.12 | 170.26 | 170.96 | 172.11 |
| Pivot points | S3 | S2 | S1 | PP | R1 | R2 | R3 |
|---|---|---|---|---|---|---|---|
| Standard | 166.29 | 167.77 | 168.73 | 170.21 | 171.17 | 172.65 | 173.61 |
| Camarilla | 169.01 | 169.23 | 169.46 | 169.68 | 169.90 | 170.13 | 170.35 |
| Woodie | 166.02 | 167.64 | 168.46 | 170.08 | 170.90 | 172.52 | 173.34 |
| Fibonacci | 167.77 | 168.71 | 169.28 | 170.21 | 171.15 | 171.72 | 172.65 |
Numerical data
The following is the status of technical indicators and moving averages registered at the time this technical analysis was created:
| RSI (14): | 38.01 | |
| MACD (12,26,9): | -0.5800 | |
| Directional Movement: | -12.40 | |
| AROON (14): | -28.57 | |
| DEMA (21): | 167.87 | |
| Parabolic SAR (0,02-0,02-0,2): | 170.59 | |
| Elder Ray (13): | -1.15 | |
| Super Trend (3,10): | 170.43 | |
| Zig ZAG (10): | 167.11 | |
| VORTEX (21): | 0.8300 | |
| Stochastique (14,3,5): | 12.39 | |
| TEMA (21): | 167.49 | |
| Williams %R (14): | -87.53 | |
| Chande Momentum Oscillator (20): | -1.11 | |
| Repulse (5,40,3): | -0.6000 | |
| ROCnROLL: | 2 | |
| TRIX (15,9): | -0.0400 | |
| Courbe Coppock: | 0.88 |
| MA7: | 168.25 | |
| MA20: | 168.53 | |
| MA50: | 169.78 | |
| MA100: | 168.94 | |
| MAexp7: | 167.86 | |
| MAexp20: | 168.59 | |
| MAexp50: | 169.06 | |
| MAexp100: | 168.27 | |
| Price / MA7: | -0.68% | |
| Price / MA20: | -0.85% | |
| Price / MA50: | -1.58% | |
| Price / MA100: | -1.09% | |
| Price / MAexp7: | -0.45% | |
| Price / MAexp20: | -0.88% | |
| Price / MAexp50: | -1.16% | |
| Price / MAexp100: | -0.70% |
News
The latest news and videos published on CHF/JPY at the time of the analysis were as follows:
-
 CHF/JPY Forecast February 26, 2024
-
CHF/JPY Forecast October 5, 2022
-
CHFJPY Potential Swing to the Long Side
-
CHF JPY: Set for another move lower?
About author

Online


Add a comment
Comments
0 comments on the analysis CHF/JPY - Daily