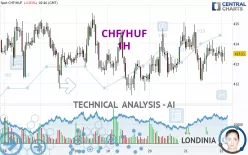
CHF/HUF - 1H - Technical analysis published on 08/22/2024 (GMT)
- 104
- 0
Click here for a new analysis!
- Timeframe : 1H
- - Analysis generated on
- Status : TARGET REACHED

Summary of the analysis

Additional analysis
Quotes
The CHF/HUF price is 413.51 HUF. On the day, this instrument lost -0.02% and was traded between 413.01 HUF and 413.89 HUF over the period. The price is currently at +0.12% from its lowest and -0.09% from its highest.A study of price movements over other periods shows the following variations:
Near a new HIGH record (1 year)
Type : Bullish
Timeframe : Weekly
Near a new HIGH record (1st january)
Type : Bullish
Timeframe : Weekly
Near a new HIGH record (1 month)
Type : Bullish
Timeframe : Weekly
Technical
Technical analysis of this 1H chart of CHF/HUF indicates that the overall trend is slightly bullish. 57.14% of the signals given by moving averages are bullish. The slightly bullish signals given by short-term moving averages do not show a strengthening of this global trend. The Central Indicators scanner detects a bearish signal on moving averages that could impact this trend:
Moving Average bearish crossovers : MA20 & MA50
Type : Bearish
Timeframe : 1 hour
In fact, according to the parameters integrated into the Central Analyzer system, only 9 technical indicators out of 18 analysed are currently bullish. Central Indicators, the detector scanner for these technical indicators recently detected a signal:
Price is back over the pivot point
Type : Bullish
Timeframe : 1 hour
Central Patterns, the market scanner focusing on chart patterns, resistances and supports found these results:
Near resistance of channel
Type : Bearish
Timeframe : 1 hour
Near resistance of triangle
Type : Bearish
Timeframe : 1 hour
The Central Candlesticks scanner which studies Japanese candlesticks did not detect anything.
| S3 | S2 | S1 | Price | R1 | R2 | R3 | |
|---|---|---|---|---|---|---|---|
| ProTrendLines | 411.76 | 412.78 | 413.41 | 413.51 | 414.19 | 415.53 | 417.05 |
| Change (%) | -0.42% | -0.18% | -0.02% | - | +0.16% | +0.49% | +0.86% |
| Change | -1.75 | -0.73 | -0.10 | - | +0.68 | +2.02 | +3.54 |
| Level | Intermediate | Intermediate | Minor | - | Intermediate | Intermediate | Major |
Attention could also be paid to pivot points to set price objectives:
| Pivot points | S3 | S2 | S1 | PP | R1 | R2 | R3 |
|---|---|---|---|---|---|---|---|
| Standard | 409.32 | 410.72 | 412.15 | 413.55 | 414.98 | 416.38 | 417.81 |
| Camarilla | 412.79 | 413.05 | 413.31 | 413.57 | 413.83 | 414.09 | 414.35 |
| Woodie | 409.33 | 410.73 | 412.16 | 413.56 | 414.99 | 416.39 | 417.82 |
| Fibonacci | 410.72 | 411.80 | 412.47 | 413.55 | 414.63 | 415.30 | 416.38 |
| Pivot points | S3 | S2 | S1 | PP | R1 | R2 | R3 |
|---|---|---|---|---|---|---|---|
| Standard | 403.58 | 407.67 | 410.42 | 414.51 | 417.26 | 421.35 | 424.10 |
| Camarilla | 411.29 | 411.92 | 412.54 | 413.17 | 413.80 | 414.42 | 415.05 |
| Woodie | 402.91 | 407.34 | 409.75 | 414.18 | 416.59 | 421.02 | 423.43 |
| Fibonacci | 407.67 | 410.28 | 411.90 | 414.51 | 417.12 | 418.74 | 421.35 |
| Pivot points | S3 | S2 | S1 | PP | R1 | R2 | R3 |
|---|---|---|---|---|---|---|---|
| Standard | 386.88 | 393.22 | 403.90 | 410.24 | 420.92 | 427.26 | 437.94 |
| Camarilla | 409.91 | 411.47 | 413.03 | 414.59 | 416.15 | 417.71 | 419.27 |
| Woodie | 389.06 | 394.31 | 406.08 | 411.33 | 423.10 | 428.35 | 440.12 |
| Fibonacci | 393.22 | 399.72 | 403.74 | 410.24 | 416.74 | 420.76 | 427.26 |
Numerical data
The following is the status of technical indicators and moving averages registered at the time this technical analysis was created:
| RSI (14): | 51.16 | |
| MACD (12,26,9): | 0.0300 | |
| Directional Movement: | 0.43 | |
| AROON (14): | 42.86 | |
| DEMA (21): | 413.54 | |
| Parabolic SAR (0,02-0,02-0,2): | 413.01 | |
| Elder Ray (13): | -0.04 | |
| Super Trend (3,10): | 415.14 | |
| Zig ZAG (10): | 413.58 | |
| VORTEX (21): | 0.9700 | |
| Stochastique (14,3,5): | 60.96 | |
| TEMA (21): | 413.51 | |
| Williams %R (14): | -37.34 | |
| Chande Momentum Oscillator (20): | 0.21 | |
| Repulse (5,40,3): | 0.0900 | |
| ROCnROLL: | 1 | |
| TRIX (15,9): | 0.0000 | |
| Courbe Coppock: | 0.16 |
| MA7: | 413.54 | |
| MA20: | 416.38 | |
| MA50: | 411.55 | |
| MA100: | 405.38 | |
| MAexp7: | 413.53 | |
| MAexp20: | 413.51 | |
| MAexp50: | 413.43 | |
| MAexp100: | 413.61 | |
| Price / MA7: | -0.01% | |
| Price / MA20: | -0.69% | |
| Price / MA50: | +0.48% | |
| Price / MA100: | +2.01% | |
| Price / MAexp7: | +0.00% | |
| Price / MAexp20: | -0% | |
| Price / MAexp50: | +0.02% | |
| Price / MAexp100: | -0.02% |
About author
Online


Add a comment
Comments
0 comments on the analysis CHF/HUF - 1H