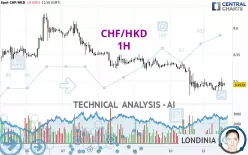
CHF/HKD - 1H - Technical analysis published on 01/13/2025 (GMT)
- 88
- 0
Click here for a new analysis!
- Timeframe : 1H
- - Analysis generated on
- Status : TARGET REACHED

Summary of the analysis

Additional analysis
Quotes
The CHF/HKD rating is 8.4939 HKD. The price registered a decrease of -0.03% on the session with the lowest point at 8.4818 HKD and the highest point at 8.5067 HKD. The deviation from the price is +0.14% for the low point and -0.15% for the high point.A bearish opening was detected by the Central Gaps scanner. Sellers are trying to impose a bearish trend in the very short term.
Bearish opening
Type : Bearish
Timeframe : Openning
So that you have an overall view of the price change, here is a table showing the variations over several periods:
Near a new LOW record (1 year)
Type : Bearish
Timeframe : Weekly
Near a new HIGH record (1st january)
Type : Bullish
Timeframe : Weekly
Near a new HIGH record (1 month)
Type : Bullish
Timeframe : Weekly
Technical
Technical analysis of this 1H chart of CHF/HKD indicates that the overall trend is strongly bearish. 82.14% of the signals given by moving averages are bearish. Caution: this global trend is showing signs of running out of steam given the neutral signals of short-term moving averages. The Central Indicators scanner detects a bullish signal on moving averages that could impact this trend:
Moving Average bullish crossovers : AMA50 & AMA100
Type : Bullish
Timeframe : 1 hour
In fact, of the 18 technical indicators analysed by Central Analyzer, 7 are bullish, 7 are neutral and 4 are bearish. Central Indicators, the scanner specialised in technical indicators, has identified this signal:
Momentum indicator is back over 0
Type : Bullish
Timeframe : 1 hour
An analysis of the price chart with the Central Patterns scanner (detector of chart patterns and resistances and supports) shows several results that can have an impact on the price change:
Near horizontal resistance
Type : Bearish
Timeframe : 1 hour
Resistance of channel is broken
Type : Bullish
Timeframe : 1 hour
The Central Candlesticks scanner, specialised in Japanese candlesticks, did not identify any signals.
| S3 | S2 | S1 | Price | R1 | R2 | R3 | |
|---|---|---|---|---|---|---|---|
| ProTrendLines | 8.3312 | 8.4738 | 8.4896 | 8.4939 | 8.5263 | 8.5670 | 8.6034 |
| Change (%) | -1.92% | -0.24% | -0.05% | - | +0.38% | +0.86% | +1.29% |
| Change | -0.1627 | -0.0201 | -0.0043 | - | +0.0324 | +0.0731 | +0.1095 |
| Level | Major | Intermediate | Major | - | Minor | Minor | Intermediate |
Attention could also be paid to pivot points to set price objectives:
| Pivot points | S3 | S2 | S1 | PP | R1 | R2 | R3 |
|---|---|---|---|---|---|---|---|
| Standard | 8.4043 | 8.4390 | 8.4676 | 8.5023 | 8.5309 | 8.5656 | 8.5942 |
| Camarilla | 8.4787 | 8.4845 | 8.4903 | 8.4961 | 8.5019 | 8.5077 | 8.5135 |
| Woodie | 8.4012 | 8.4375 | 8.4645 | 8.5008 | 8.5278 | 8.5641 | 8.5911 |
| Fibonacci | 8.4390 | 8.4632 | 8.4782 | 8.5023 | 8.5265 | 8.5415 | 8.5656 |
| Pivot points | S3 | S2 | S1 | PP | R1 | R2 | R3 |
|---|---|---|---|---|---|---|---|
| Standard | 8.2828 | 8.3783 | 8.4372 | 8.5327 | 8.5916 | 8.6871 | 8.7460 |
| Camarilla | 8.4536 | 8.4678 | 8.4820 | 8.4961 | 8.5103 | 8.5244 | 8.5386 |
| Woodie | 8.2645 | 8.3692 | 8.4189 | 8.5236 | 8.5733 | 8.6780 | 8.7277 |
| Fibonacci | 8.3783 | 8.4373 | 8.4737 | 8.5327 | 8.5917 | 8.6281 | 8.6871 |
| Pivot points | S3 | S2 | S1 | PP | R1 | R2 | R3 |
|---|---|---|---|---|---|---|---|
| Standard | 8.0939 | 8.3243 | 8.4427 | 8.6731 | 8.7915 | 9.0219 | 9.1403 |
| Camarilla | 8.4652 | 8.4972 | 8.5291 | 8.5611 | 8.5931 | 8.6251 | 8.6570 |
| Woodie | 8.0379 | 8.2963 | 8.3867 | 8.6451 | 8.7355 | 8.9939 | 9.0843 |
| Fibonacci | 8.3243 | 8.4575 | 8.5399 | 8.6731 | 8.8063 | 8.8887 | 9.0219 |
Numerical data
The following is the status of the technical indicators and moving averages at the time of publication of this technical analysis:
| RSI (14): | 45.62 | |
| MACD (12,26,9): | -0.0049 | |
| Directional Movement: | -11.7042 | |
| AROON (14): | 35.7143 | |
| DEMA (21): | 8.4880 | |
| Parabolic SAR (0,02-0,02-0,2): | 8.4821 | |
| Elder Ray (13): | 0.0002 | |
| Super Trend (3,10): | 8.5143 | |
| Zig ZAG (10): | 8.4923 | |
| VORTEX (21): | 1.0033 | |
| Stochastique (14,3,5): | 46.45 | |
| TEMA (21): | 8.4903 | |
| Williams %R (14): | -54.62 | |
| Chande Momentum Oscillator (20): | 0.0005 | |
| Repulse (5,40,3): | -0.0059 | |
| ROCnROLL: | 2 | |
| TRIX (15,9): | -0.0121 | |
| Courbe Coppock: | 0.01 |
| MA7: | 8.5377 | |
| MA20: | 8.6020 | |
| MA50: | 8.7355 | |
| MA100: | 8.9275 | |
| MAexp7: | 8.4930 | |
| MAexp20: | 8.4960 | |
| MAexp50: | 8.5089 | |
| MAexp100: | 8.5255 | |
| Price / MA7: | -0.51% | |
| Price / MA20: | -1.26% | |
| Price / MA50: | -2.77% | |
| Price / MA100: | -4.86% | |
| Price / MAexp7: | +0.01% | |
| Price / MAexp20: | -0.02% | |
| Price / MAexp50: | -0.18% | |
| Price / MAexp100: | -0.37% |
About author
Online


Add a comment
Comments
0 comments on the analysis CHF/HKD - 1H