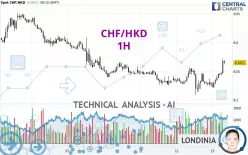
CHF/HKD - 1H - Technical analysis published on 02/13/2025 (GMT)
- 183
- 0
Click here for a new analysis!
- Timeframe : 1H
- - Analysis generated on
- Status : TARGET REACHED

Summary of the analysis

Additional analysis
Quotes
The CHF/HKD price is 8.5651 HKD. On the day, this instrument gained +0.45% and was between 8.5211 HKD and 8.5712 HKD. This implies that the price is at +0.52% from its lowest and at -0.07% from its highest.The Central Gaps scanner detects a bullish opening. A small advantage for buyers in the very short term.
Bullish opening
Type : Bullish
Timeframe : Openning
A study of price movements over other periods shows the following variations:
Near a new LOW record (1 year)
Type : Bearish
Timeframe : Weekly
Near a new HIGH record (1st january)
Type : Bullish
Timeframe : Weekly
Near a new HIGH record (1 month)
Type : Bullish
Timeframe : Weekly
Technical
A technical analysis in 1H of this CHF/HKD chart shows a slightly bullish trend. 60.71% of the signals given by moving averages are bullish. The overall trend could accelerate as strong bullish signals from short-term moving averages are expected. An assessment of moving averages reveals several bullish signals that could impact this trend:
Bullish trend reversal : Moving Average 20
Type : Bullish
Timeframe : 1 hour
Bullish trend reversal : Moving Average 50
Type : Bullish
Timeframe : 1 hour
Bullish trend reversal : adaptative moving average 100
Type : Bullish
Timeframe : 1 hour
In fact, according to the parameters integrated into the Central Analyzer system, 14 technical indicators out of 18 analysed are currently bullish. Caution: the Central Indicators scanner currently detects an excess:
CCI indicator is overbought : over 100
Type : Neutral
Timeframe : 1 hour
Williams %R indicator is overbought : over -20
Type : Neutral
Timeframe : 1 hour
Pivot points : price is over resistance 1
Type : Neutral
Timeframe : 1 hour
SuperTrend indicator bullish reversal
Type : Bullish
Timeframe : 1 hour
An analysis of the price chart with the Central Patterns scanner (detector of chart patterns and resistances and supports) shows several results that can have an impact on the price change:
Near horizontal resistance
Type : Bearish
Timeframe : 1 hour
Resistance of channel is broken
Type : Bullish
Timeframe : 1 hour
The Central Candlesticks scanner currently notes the presence of this pattern in Japanese candlesticks that could mark the end of the short-term trend currently underway:
Doji
Type : Neutral
Timeframe : 1 hour
| S3 | S2 | S1 | Price | R1 | R2 | R3 | |
|---|---|---|---|---|---|---|---|
| ProTrendLines | 8.4896 | 8.5082 | 8.5432 | 8.5651 | 8.5705 | 8.6088 | 8.6513 |
| Change (%) | -0.88% | -0.66% | -0.26% | - | +0.06% | +0.51% | +1.01% |
| Change | -0.0755 | -0.0569 | -0.0219 | - | +0.0054 | +0.0437 | +0.0862 |
| Level | Major | Major | Intermediate | - | Minor | Minor | Intermediate |
Attention could also be paid to pivot points to set price objectives:
| Pivot points | S3 | S2 | S1 | PP | R1 | R2 | R3 |
|---|---|---|---|---|---|---|---|
| Standard | 8.4561 | 8.4822 | 8.5045 | 8.5306 | 8.5529 | 8.5790 | 8.6013 |
| Camarilla | 8.5136 | 8.5180 | 8.5225 | 8.5269 | 8.5313 | 8.5358 | 8.5402 |
| Woodie | 8.4543 | 8.4813 | 8.5027 | 8.5297 | 8.5511 | 8.5781 | 8.5995 |
| Fibonacci | 8.4822 | 8.5007 | 8.5121 | 8.5306 | 8.5491 | 8.5605 | 8.5790 |
| Pivot points | S3 | S2 | S1 | PP | R1 | R2 | R3 |
|---|---|---|---|---|---|---|---|
| Standard | 8.2957 | 8.3851 | 8.4725 | 8.5619 | 8.6493 | 8.7387 | 8.8261 |
| Camarilla | 8.5113 | 8.5275 | 8.5437 | 8.5599 | 8.5761 | 8.5923 | 8.6085 |
| Woodie | 8.2947 | 8.3846 | 8.4715 | 8.5614 | 8.6483 | 8.7382 | 8.8251 |
| Fibonacci | 8.3851 | 8.4526 | 8.4944 | 8.5619 | 8.6294 | 8.6712 | 8.7387 |
| Pivot points | S3 | S2 | S1 | PP | R1 | R2 | R3 |
|---|---|---|---|---|---|---|---|
| Standard | 8.2240 | 8.3432 | 8.4474 | 8.5666 | 8.6708 | 8.7900 | 8.8942 |
| Camarilla | 8.4902 | 8.5106 | 8.5311 | 8.5516 | 8.5721 | 8.5926 | 8.6130 |
| Woodie | 8.2165 | 8.3395 | 8.4399 | 8.5629 | 8.6633 | 8.7863 | 8.8867 |
| Fibonacci | 8.3432 | 8.4285 | 8.4813 | 8.5666 | 8.6519 | 8.7047 | 8.7900 |
Numerical data
The following are the details of the technical indicators and moving averages that were collected to generate this technical analysis:
| RSI (14): | 66.77 | |
| MACD (12,26,9): | 0.0031 | |
| Directional Movement: | 19.9083 | |
| AROON (14): | 42.8571 | |
| DEMA (21): | 8.5408 | |
| Parabolic SAR (0,02-0,02-0,2): | 8.5127 | |
| Elder Ray (13): | 0.0141 | |
| Super Trend (3,10): | 8.5250 | |
| Zig ZAG (10): | 8.5623 | |
| VORTEX (21): | 1.0071 | |
| Stochastique (14,3,5): | 95.49 | |
| TEMA (21): | 8.5462 | |
| Williams %R (14): | -7.75 | |
| Chande Momentum Oscillator (20): | 0.0312 | |
| Repulse (5,40,3): | 0.2863 | |
| ROCnROLL: | 1 | |
| TRIX (15,9): | -0.0002 | |
| Courbe Coppock: | 0.23 |
| MA7: | 8.5668 | |
| MA20: | 8.5753 | |
| MA50: | 8.6172 | |
| MA100: | 8.7821 | |
| MAexp7: | 8.5452 | |
| MAexp20: | 8.5383 | |
| MAexp50: | 8.5397 | |
| MAexp100: | 8.5490 | |
| Price / MA7: | -0.02% | |
| Price / MA20: | -0.12% | |
| Price / MA50: | -0.60% | |
| Price / MA100: | -2.47% | |
| Price / MAexp7: | +0.23% | |
| Price / MAexp20: | +0.31% | |
| Price / MAexp50: | +0.30% | |
| Price / MAexp100: | +0.19% |
About author
Online


Add a comment
Comments
0 comments on the analysis CHF/HKD - 1H